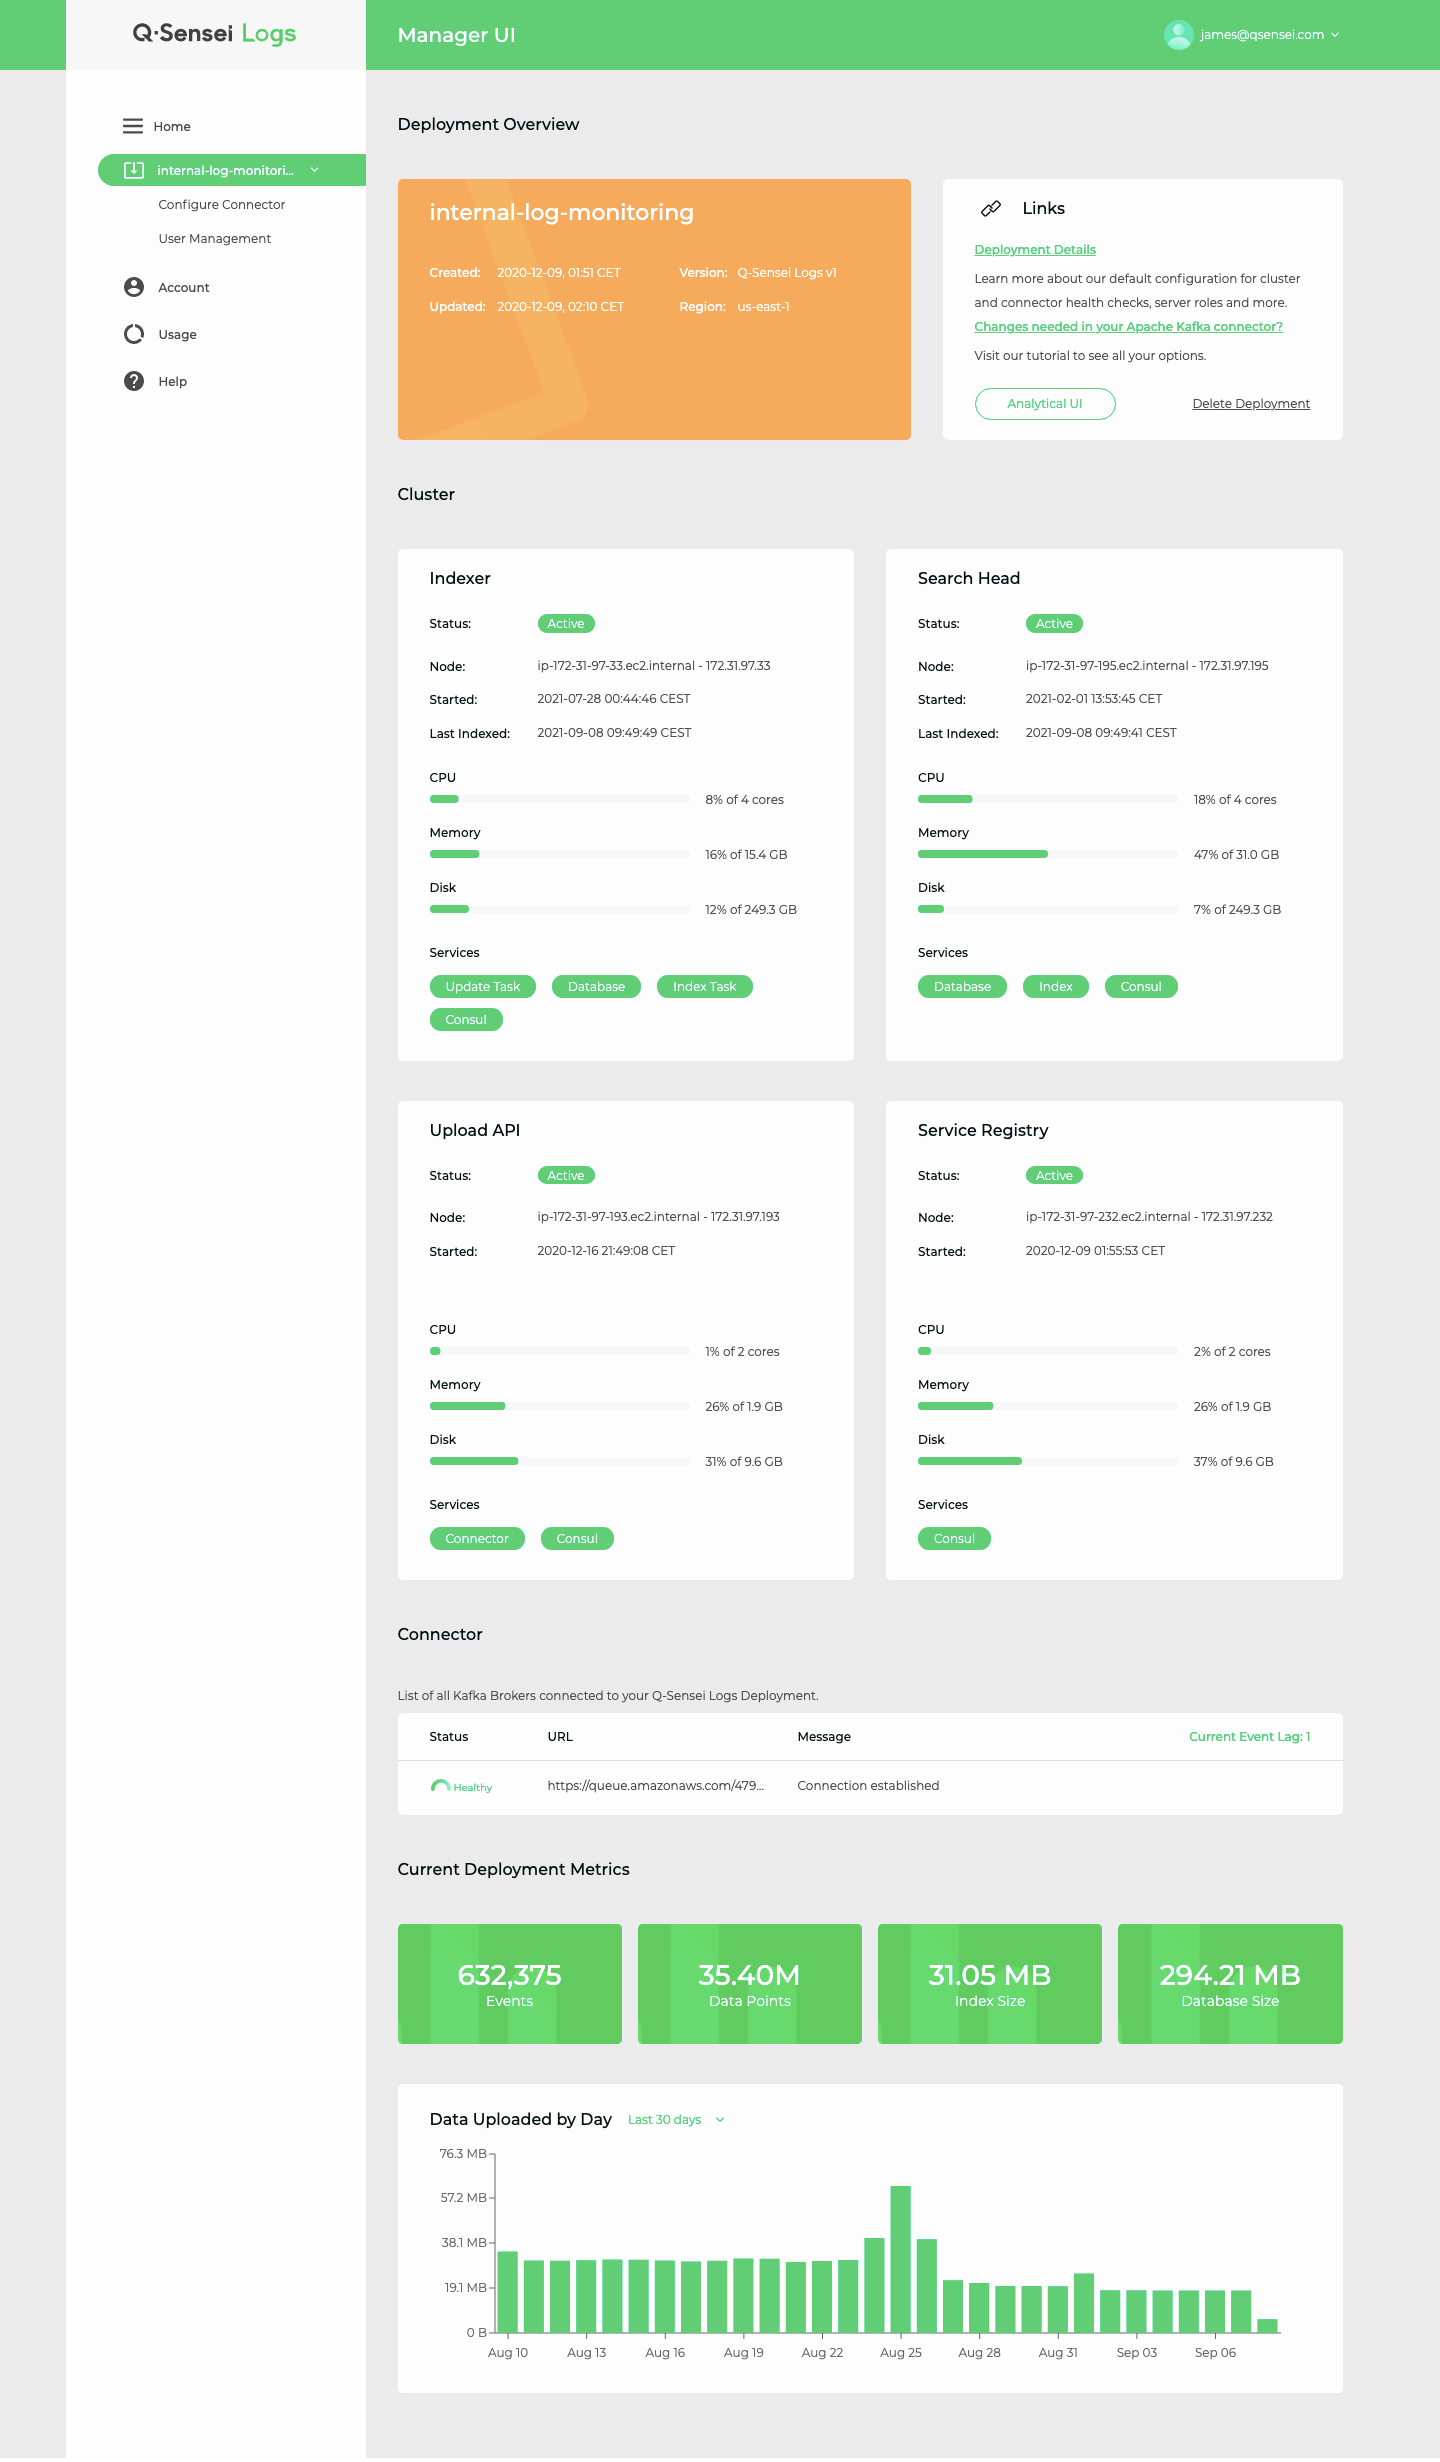
You can view the details of each deployment either by clicking on the deployment name on the left hand side or by clicking on the More Details link on the deployments overview page.
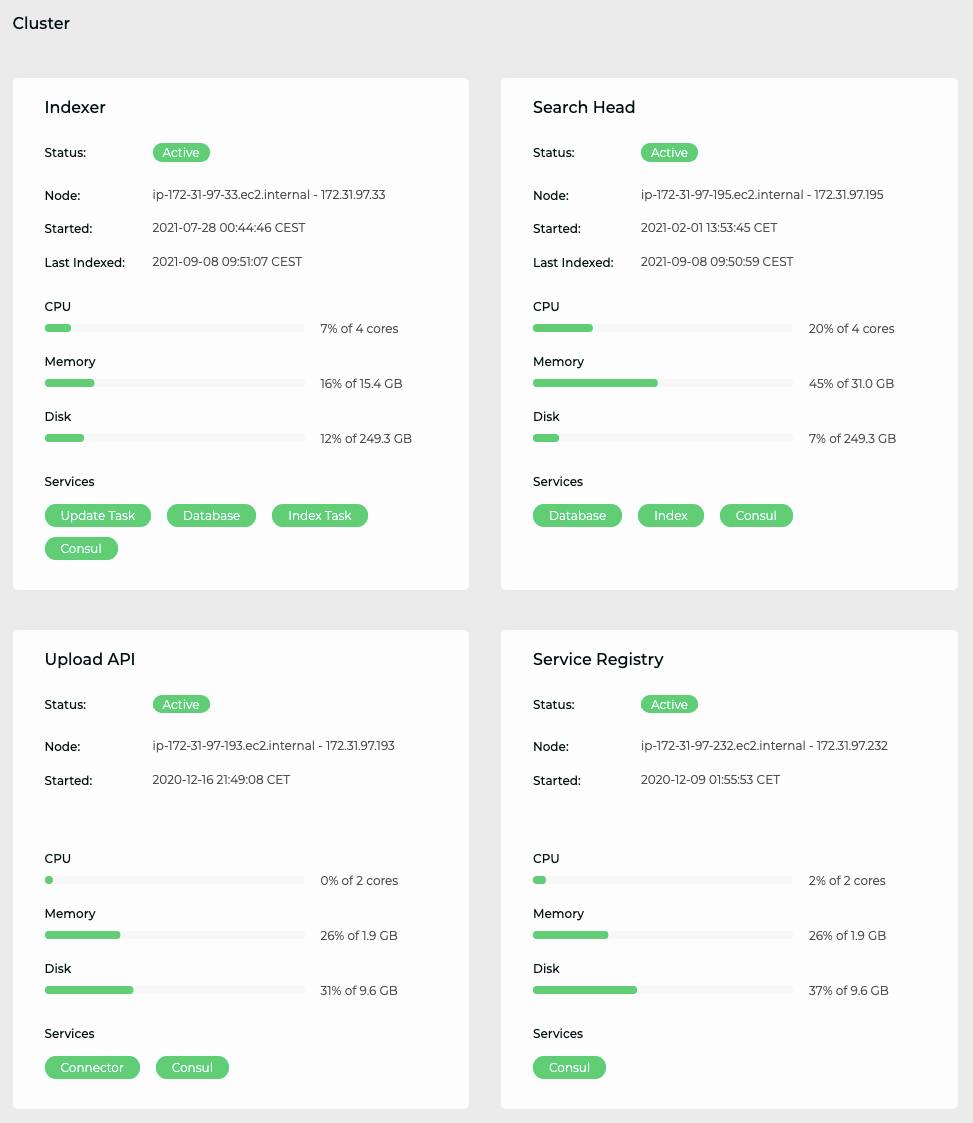
Cluster
- Shows the number of physical machines used for the deployment.
- For each machine and its services you can see the overall health status which is either Active or Down. If any of the nodes is down, the cluster status is “Down”.
- Values for CPU, memory and disk usage are updated in real-time.
Server Roles:
An indexer registers the following services in the Service Registry
- Update Task
- Index Update
- Database
A search head registers the following services in the Service Registry
- Index
- Database
The Upload API consults the service registry and forwards batches of events to healthy indexer(s).
Different nodes register services with the dynamic service registry as they join the cluster. Associated with each service is a health check to determine healthy service nodes.
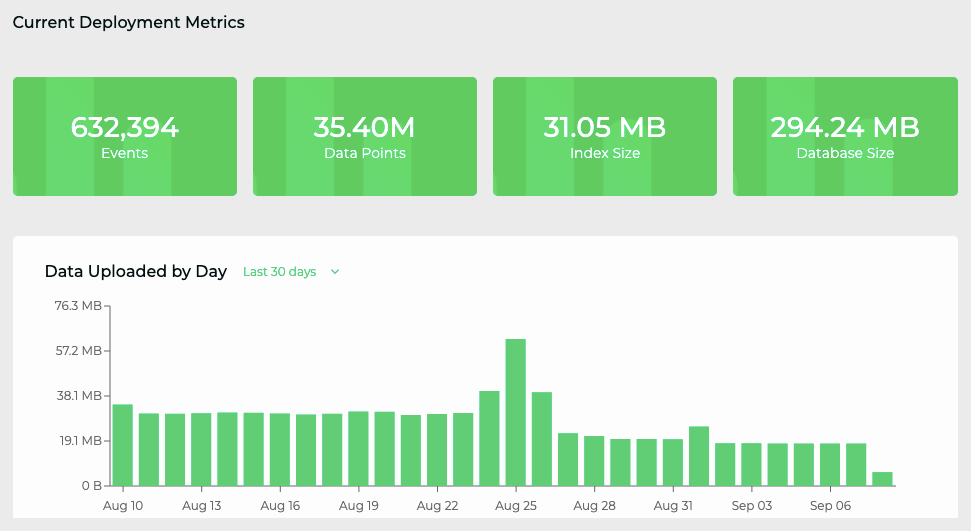
Usage
The final section under deployment details is the usage overview. The usage section shows the following
- A summary of ingested data, the size of the index, and the size of the database.
- A time series distribution of ingested data per day.


