Personalized dashboards help you to monitor new events, setup widgets and alerting. In this tutorial, you will learn how to setup dashboard an alerting.
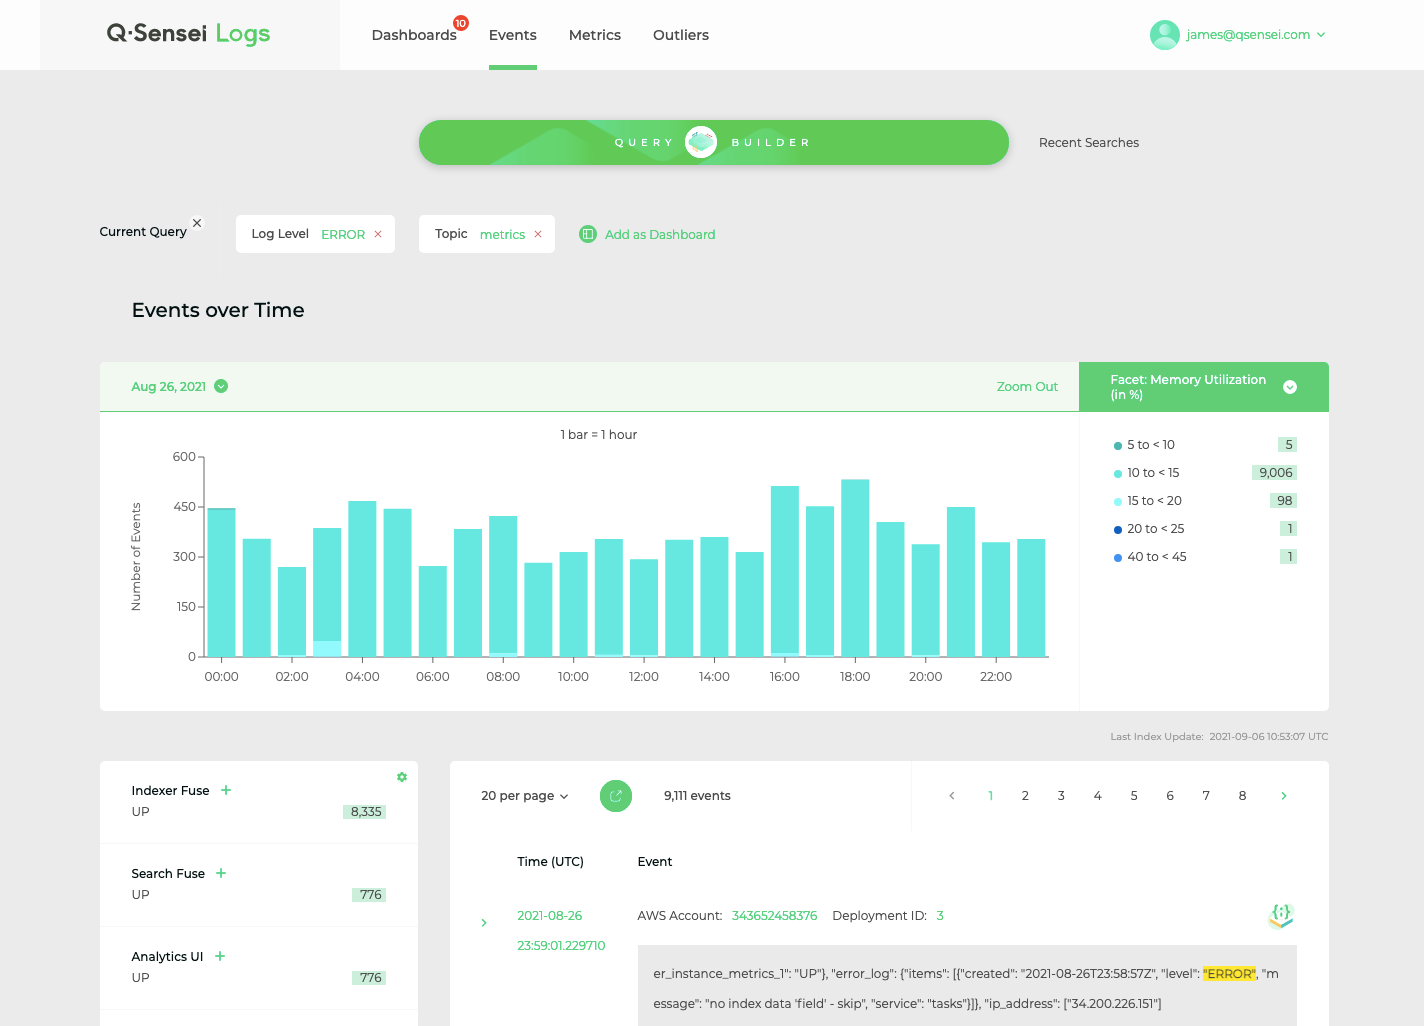
1. Query
Build any query for which you would like to monitor new events. Next to the query expression, you click on Add as Dashboard.
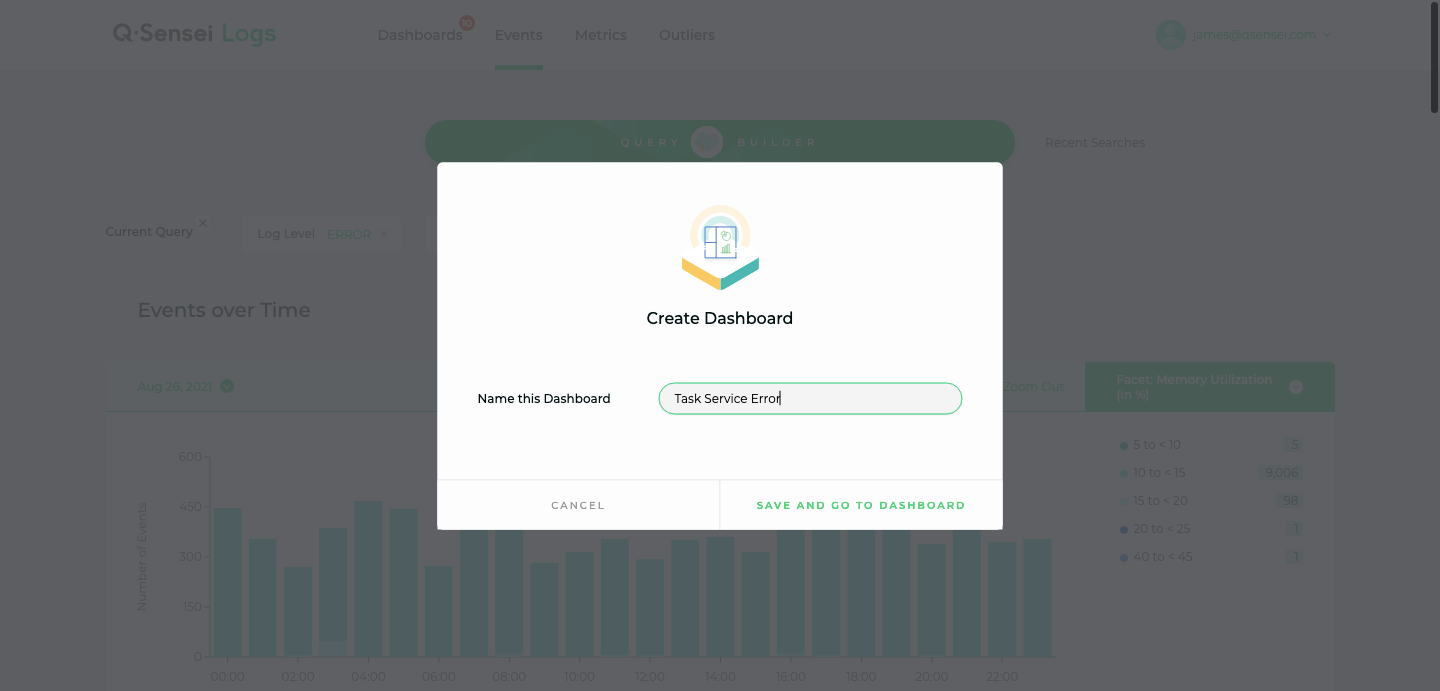
2. Create Dashboard
Give your dashboard a name. Click on Save and Go to Dashboard.
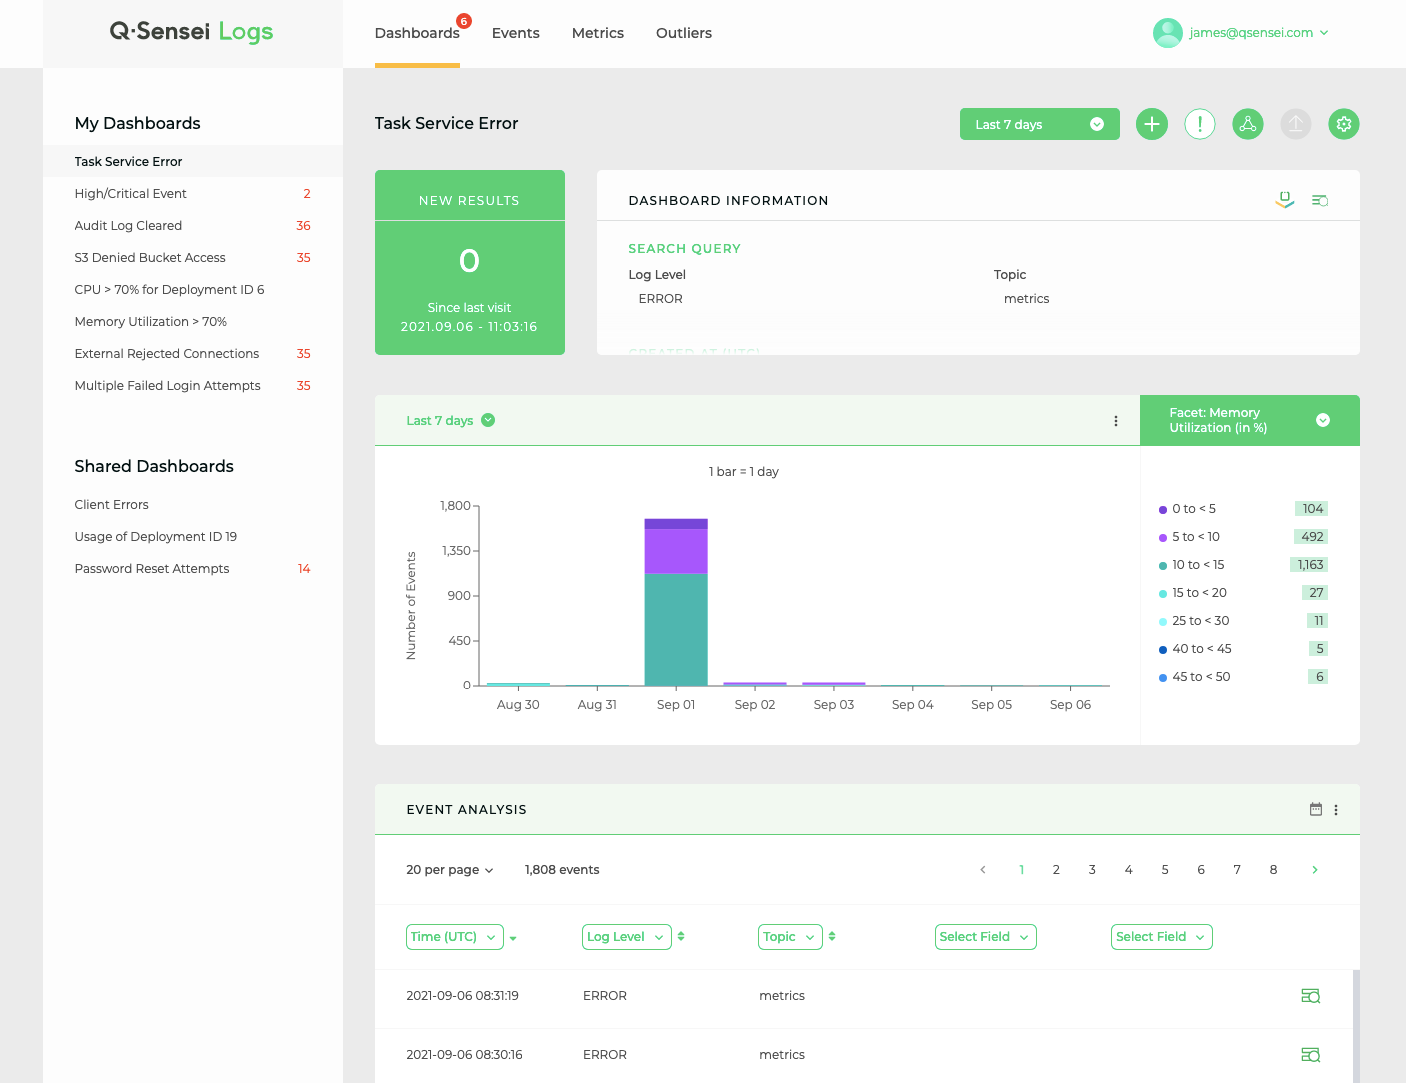
3. Verify Dashboard
As you see below, a dashboard will be created with some default widgets. You can personalize this page as you like.
4. Setup Widgets
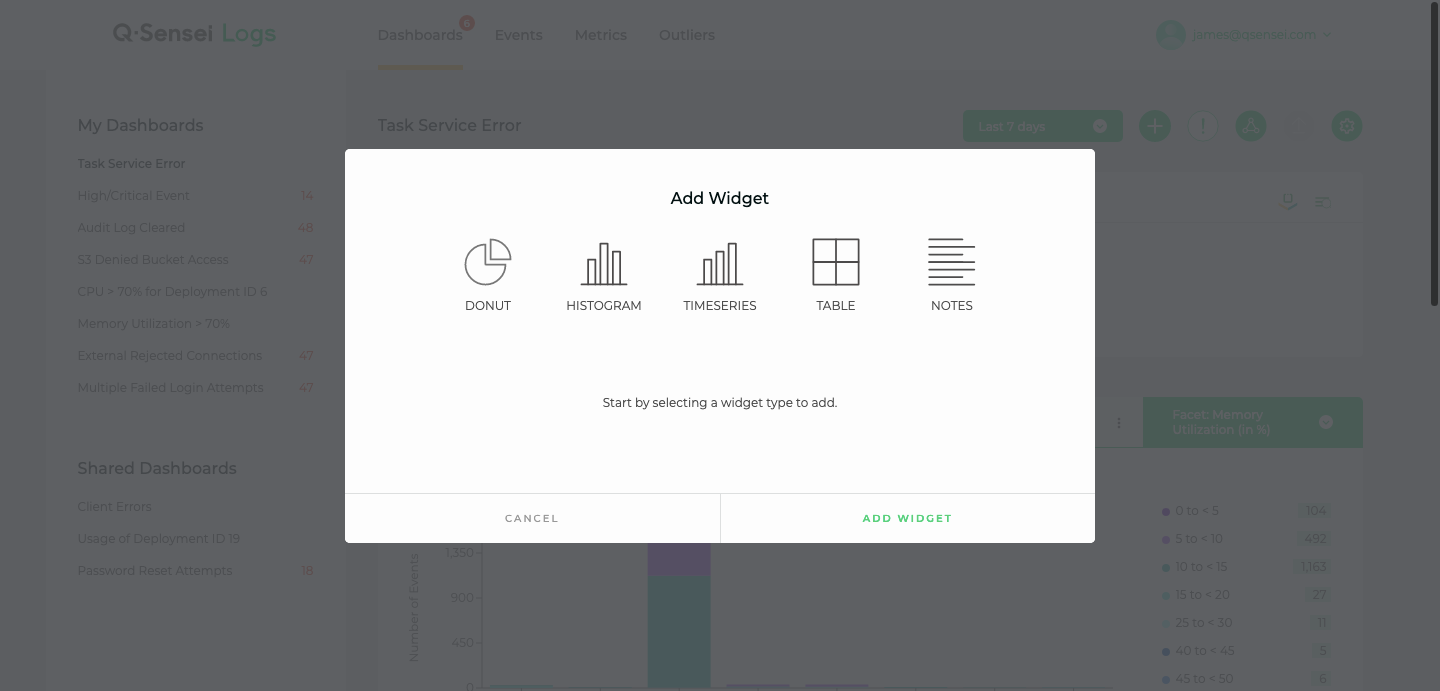
Click on the Add Widget (+) icon on the top right corner to add a widget. You will see a popup to choose from 5 different widgets:
- Donut
- Histogram
- Timeseries
- Table
- Notes
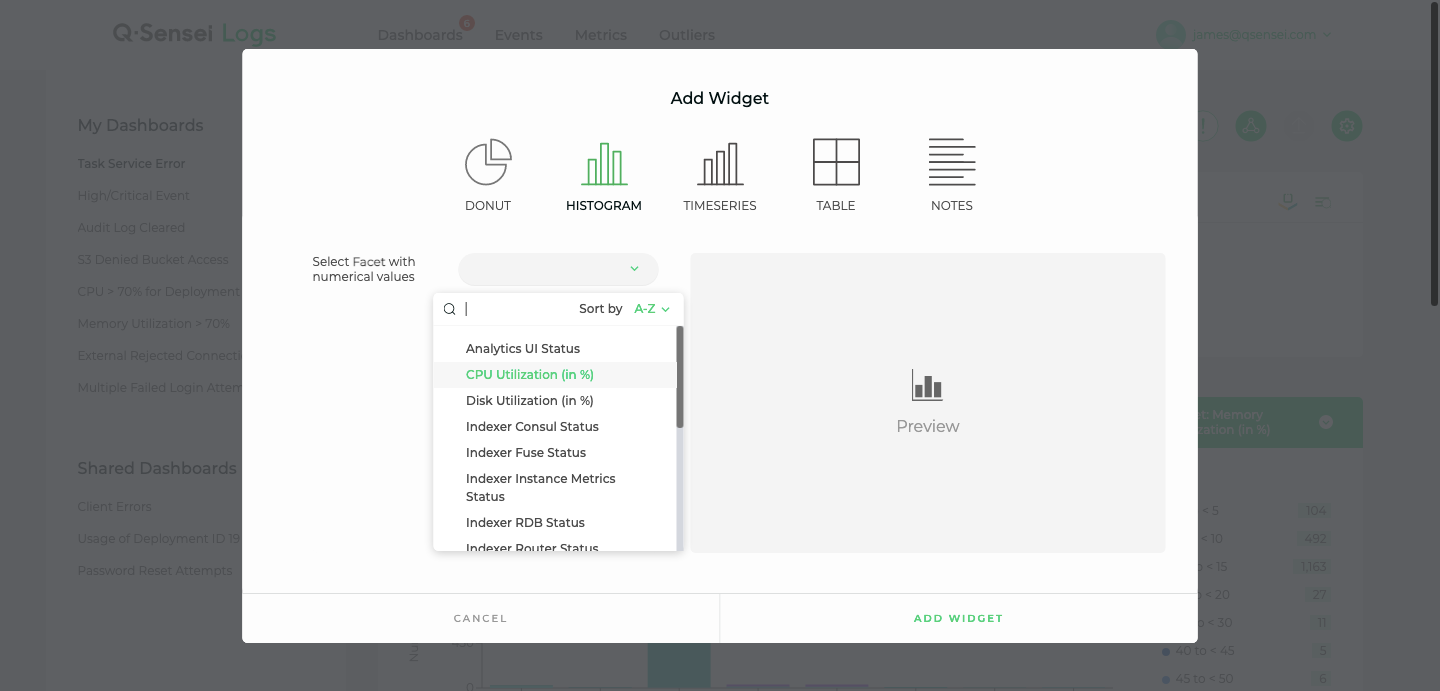
In this example, we will select Histogram. For our use case, we would correlate error events with the CPU Utilization (in %) facet.
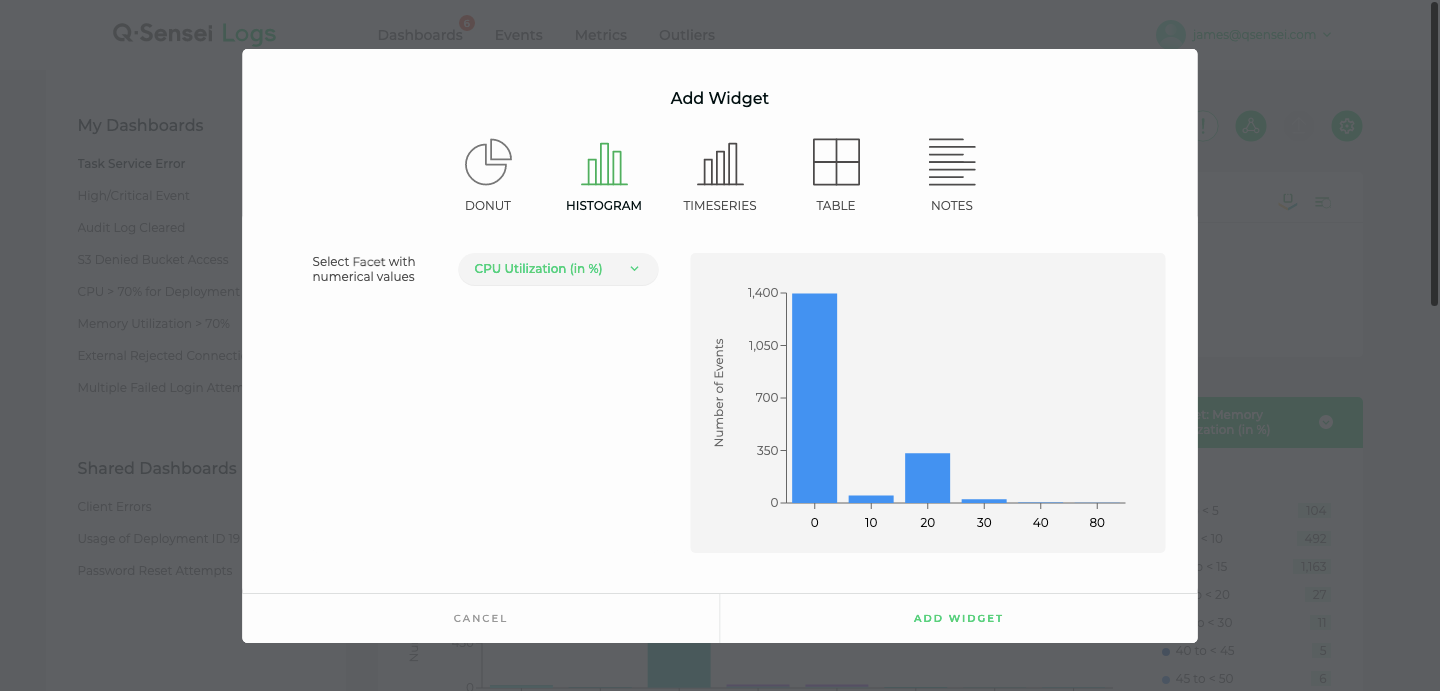
After selecting a facet, you can see a preview of the widget. Click on Add Widget.
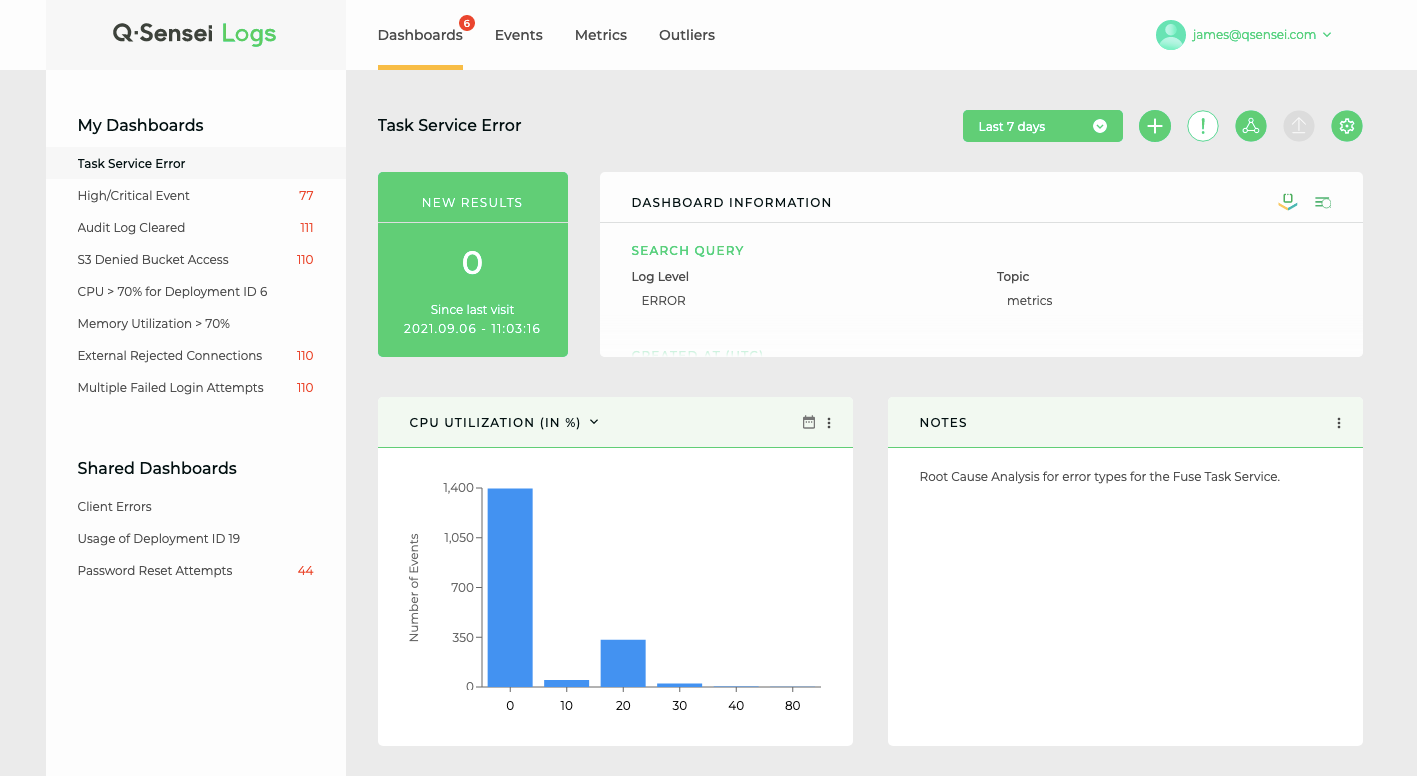
You can also add notes to refer to them. In the below screenshot, we have added two widgets.
- Histogram for CPU Utilization (in %) facet
- Notes
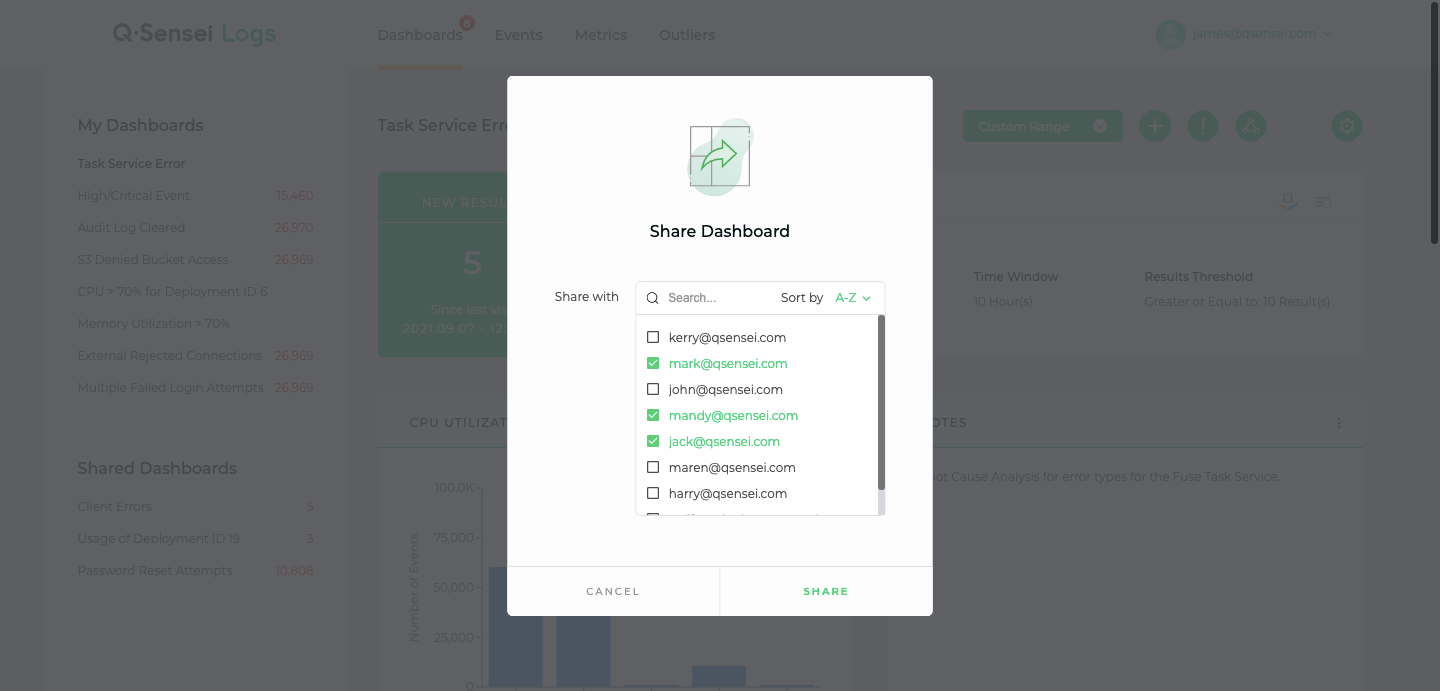
5. Share Dashboard with team members
Click on the Share icon on the top right corner. From the popup, you can select members with whom you want to share the dashboard.
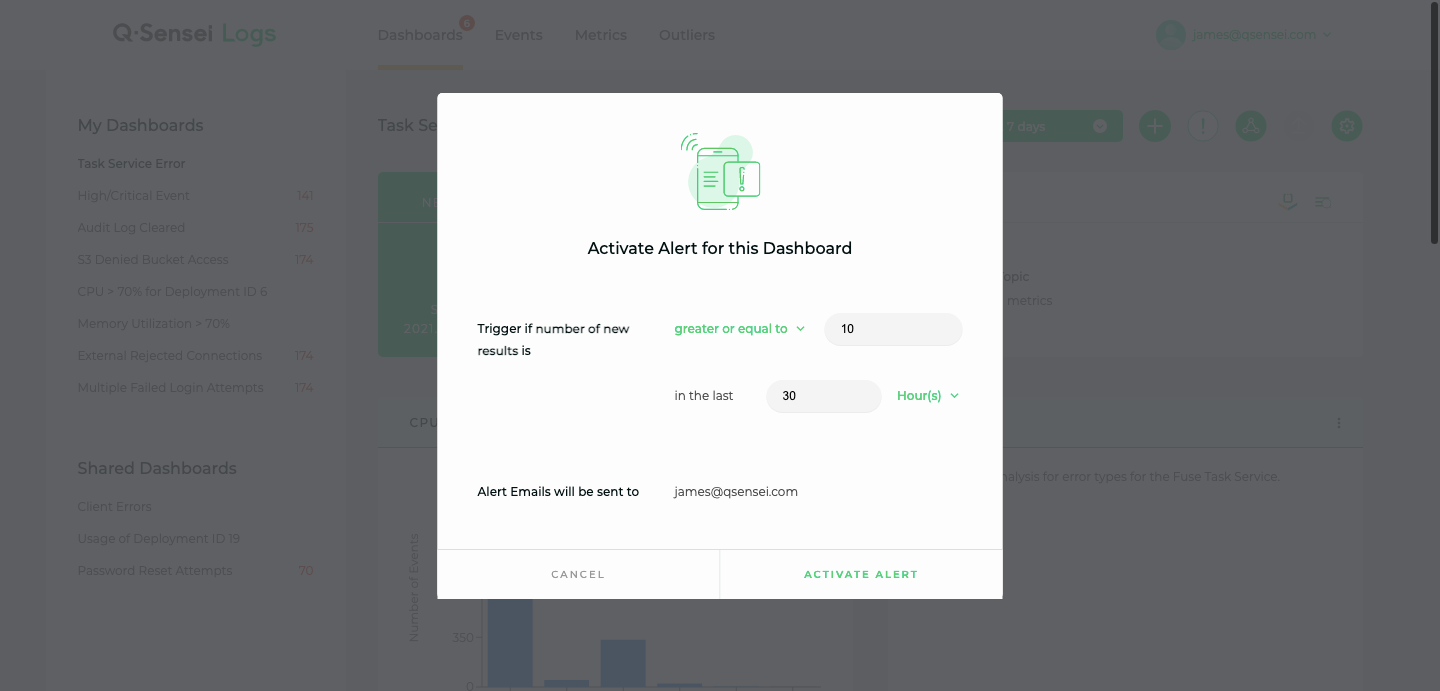
6. Setup Alerts
Click on the Alert icon on the top right corner to setup alerts. With alerts, you can receive an email notification every time alert state is active.