Q-Sensei Logs automatically extracts metrics and builds metric-facets from the log event. This is available to the user on the Metrics tab. Metrics can be used to do the following.
- Perform time series analysis to understand metric evolution
- Correlate metric with different attributes (For example correlate power consumption with vendor device characteristics)
- Compare 2 metrics for the same criteria
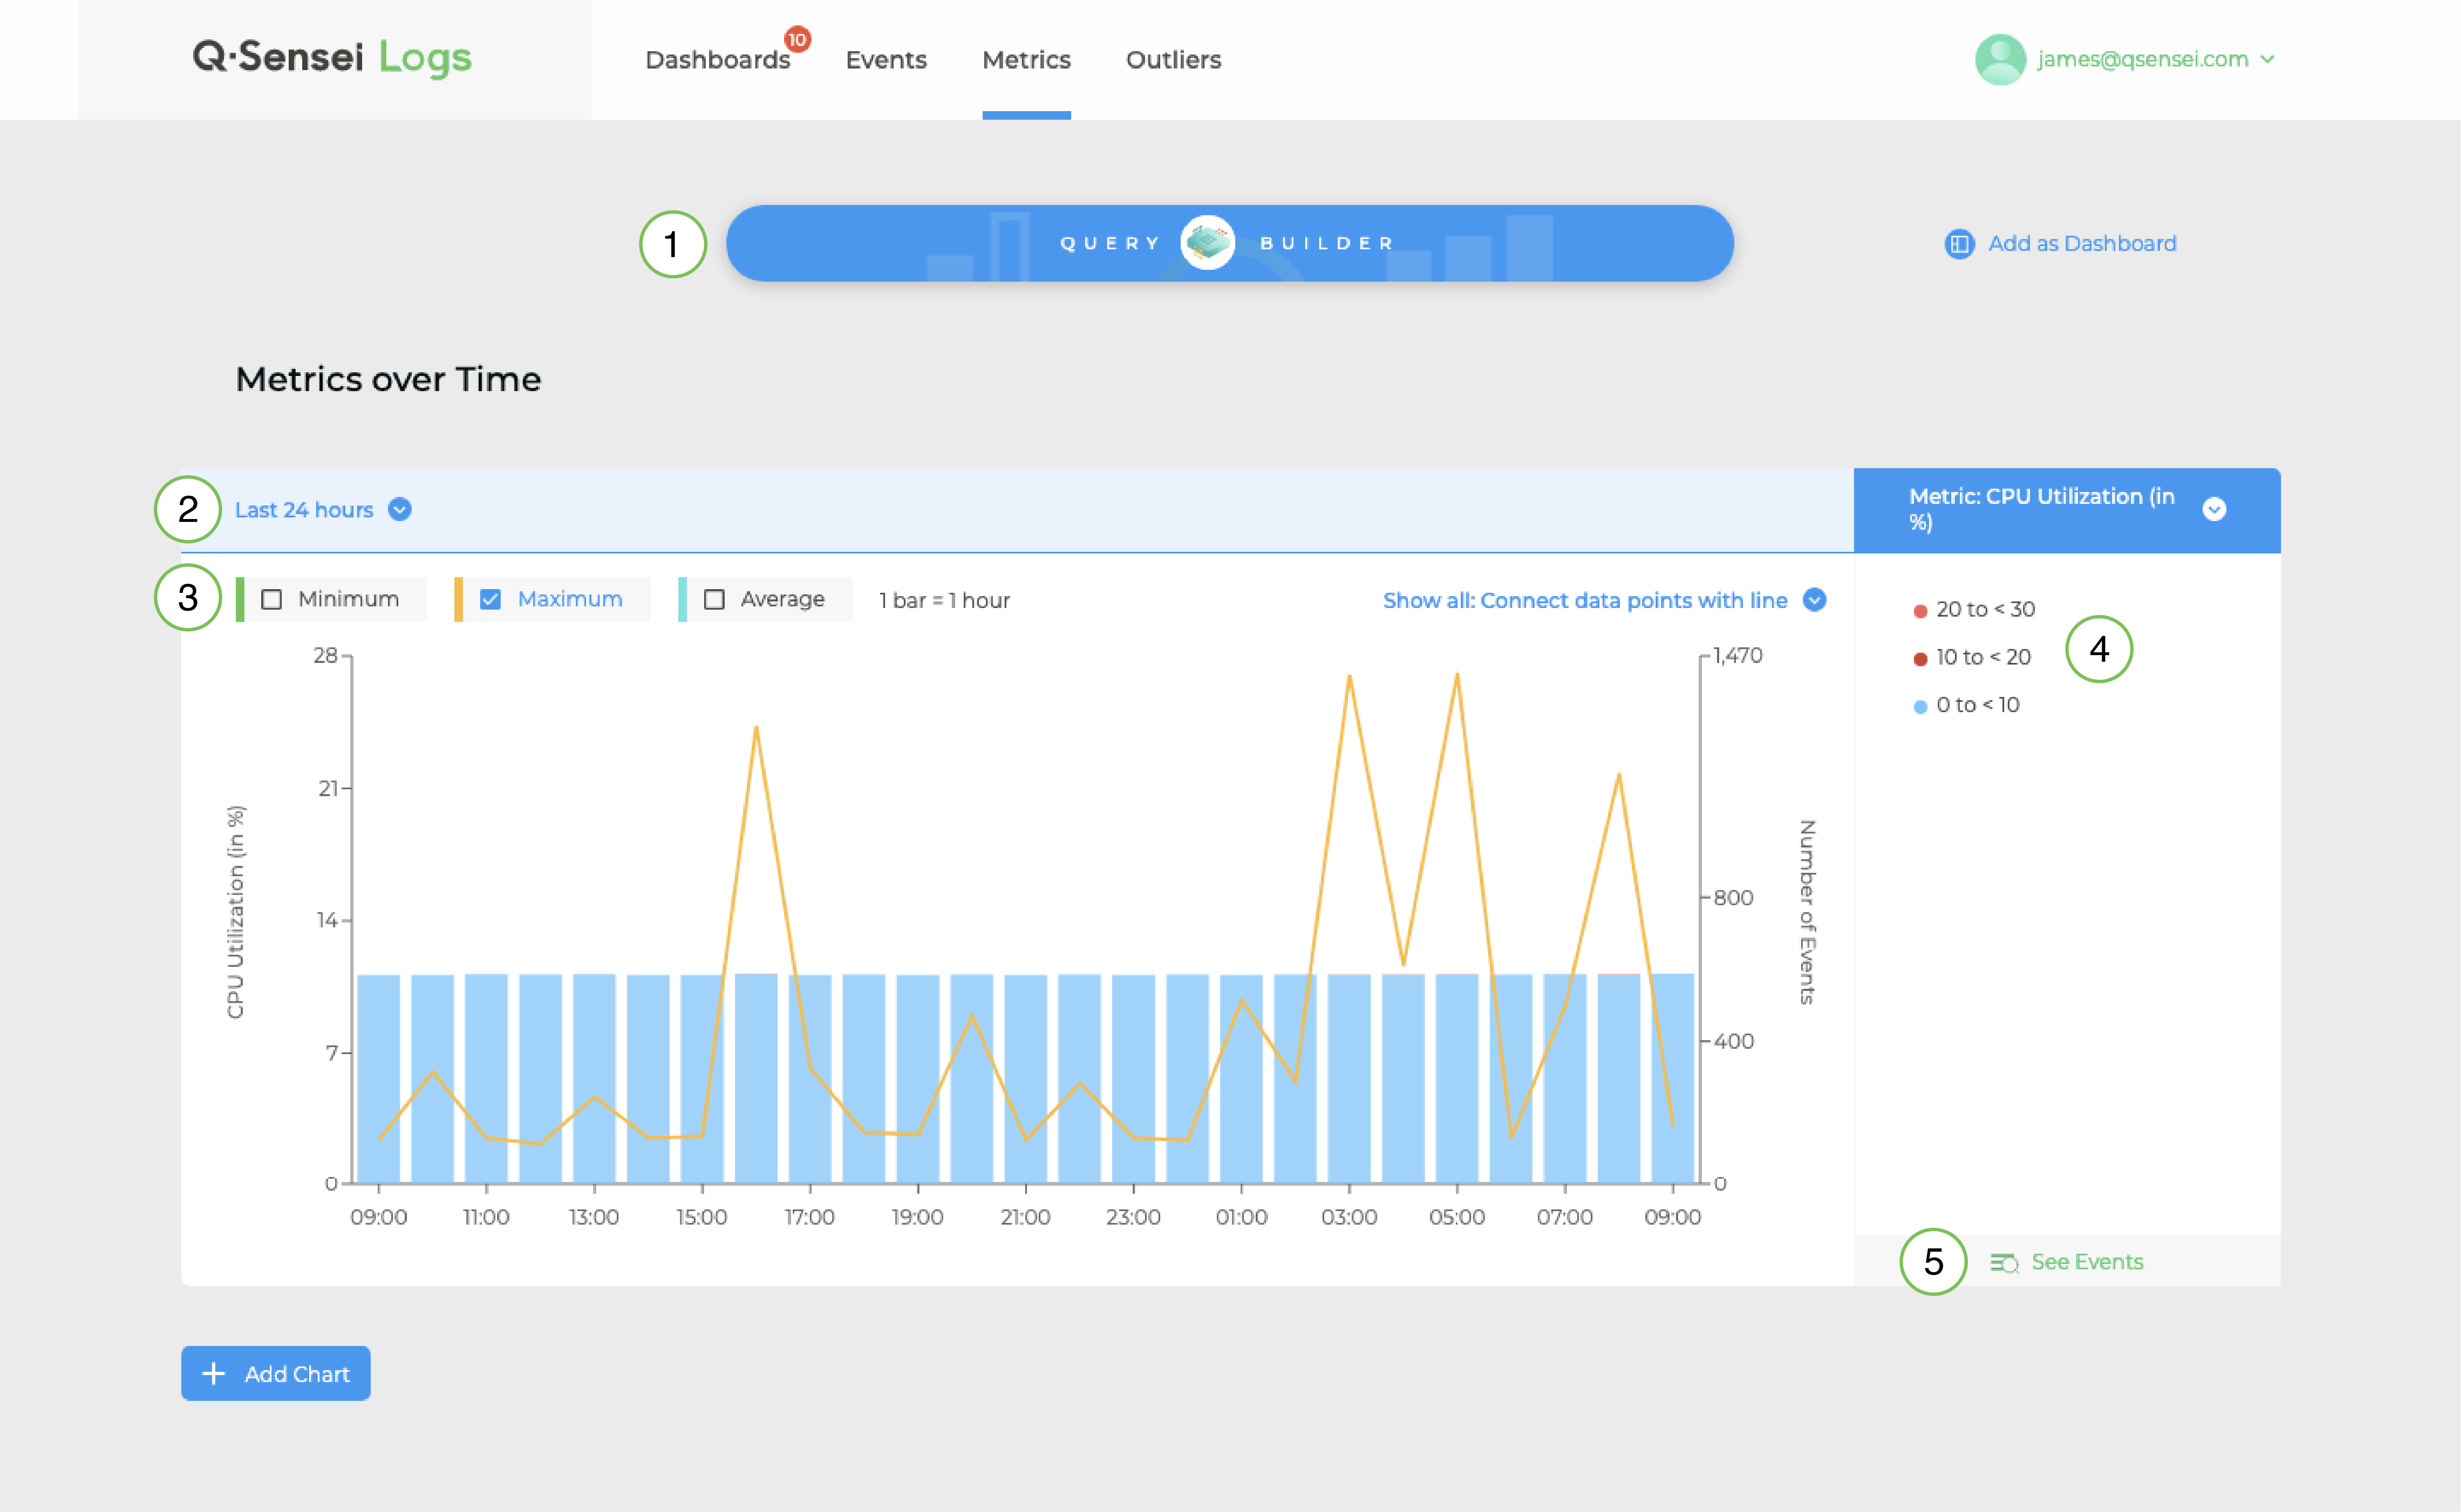
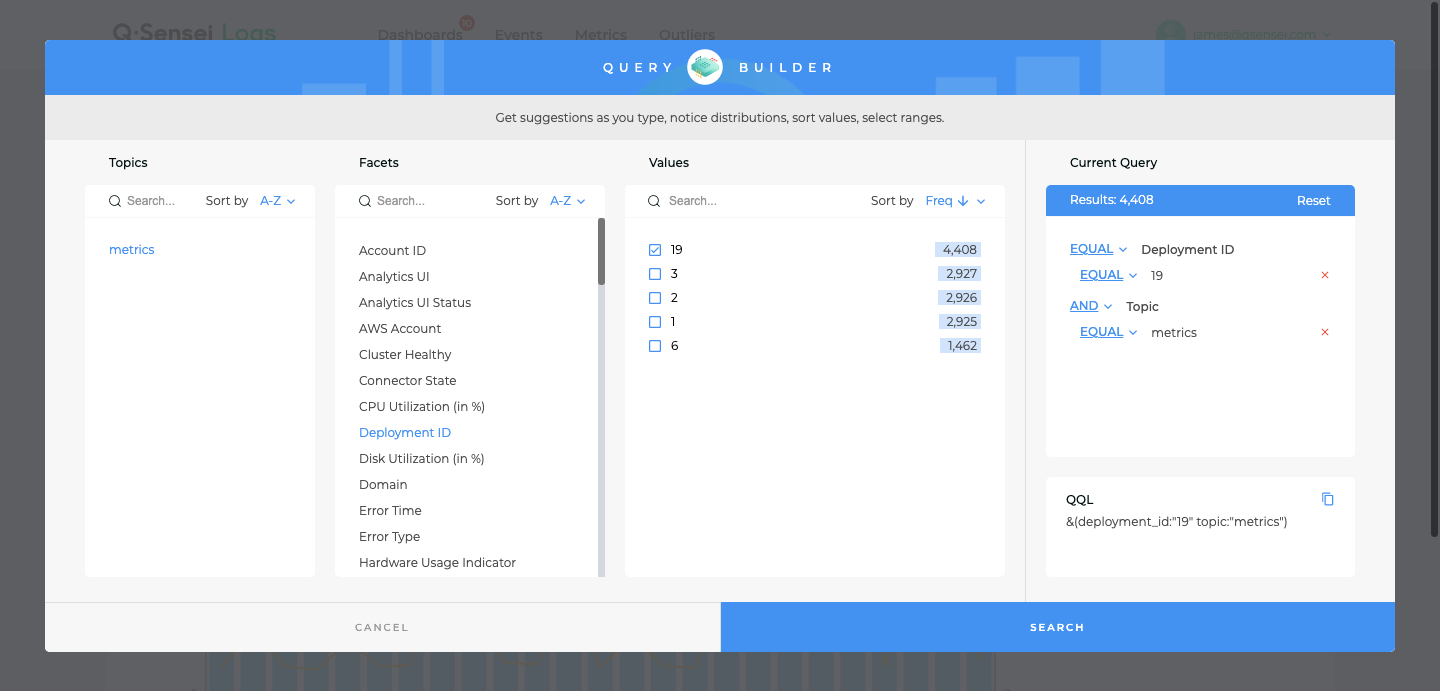
1. Query Builder
The query builder with all facets makes it easy to specify filtering criteria for metric values. In this example, we filter data points for deployment id = 19.
Evolution of CPU Utilization for deployment id = 19:
2. Time Series
With time series you can correlate metric values with time.
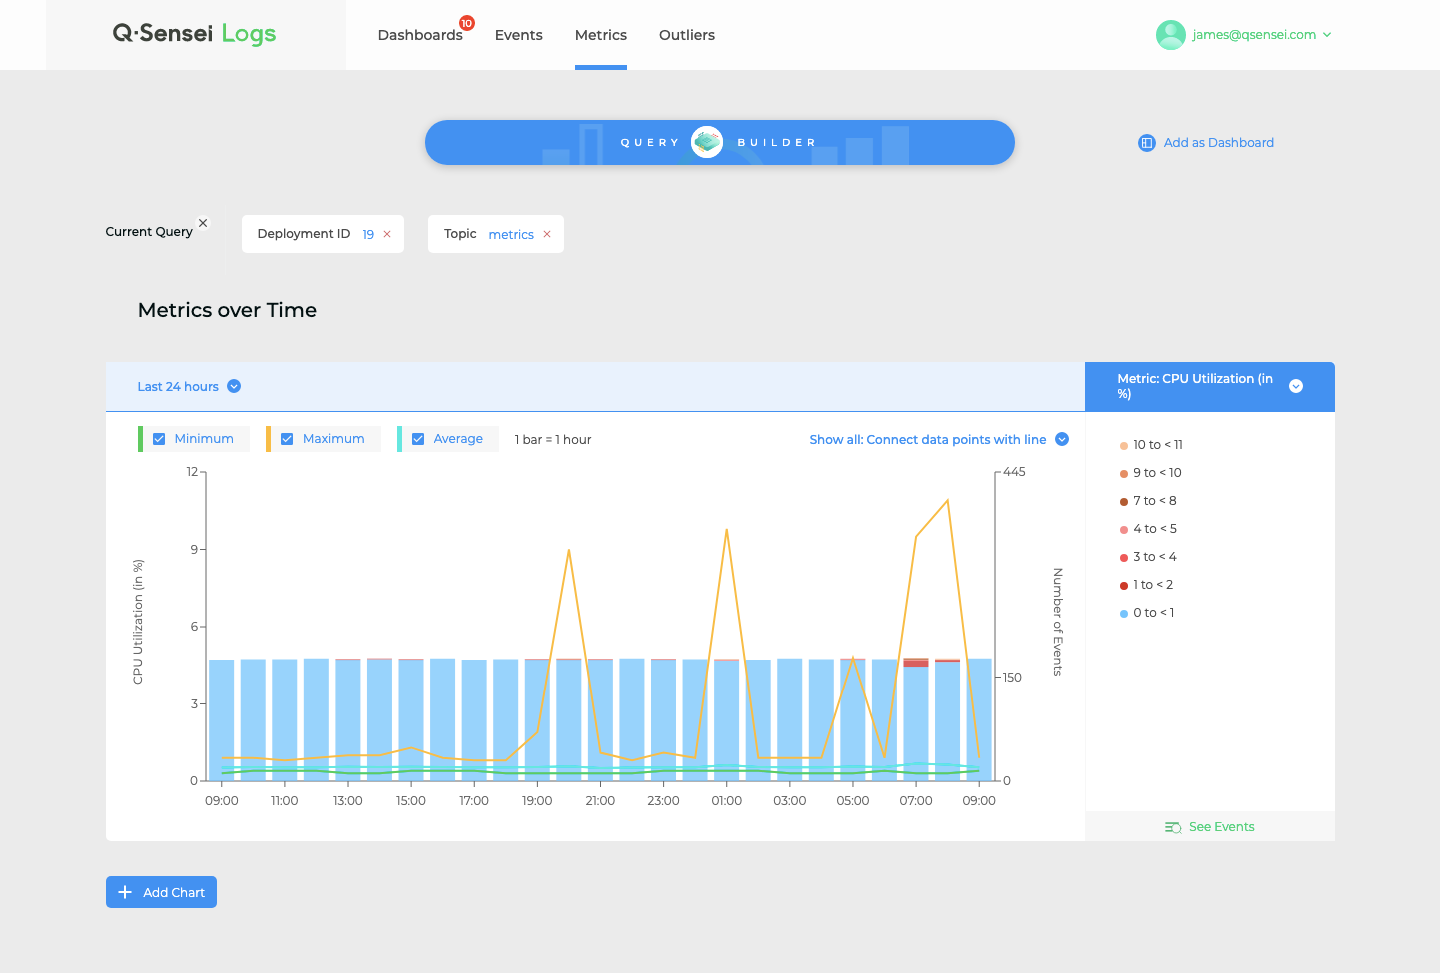
3. Summary statistics
With reduction functions, you can correlate summary statistics with time. Currently, the following reduction functions are supported:
- Minimum
- Maximum
- Average
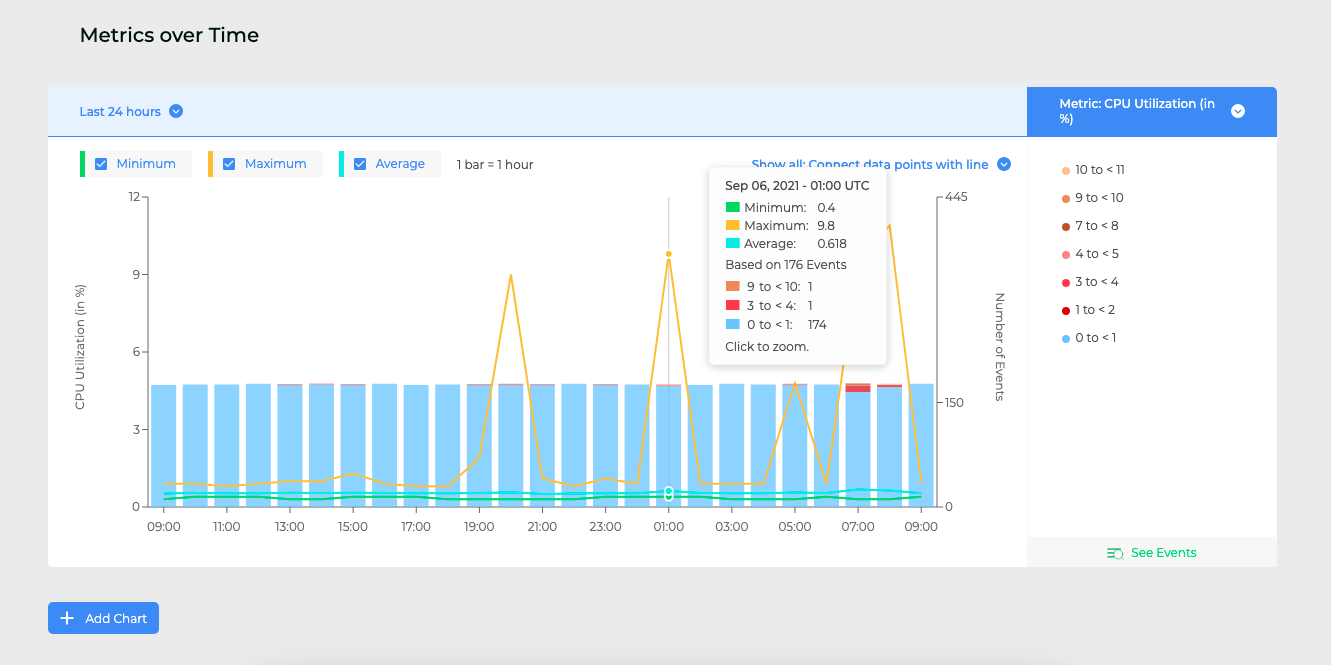
Notice in the below screenshot, summary statistics are calculated based on 176 events for September 06, 2021. You can zoom-in by clicking on the bar and get an updated summary statistic.
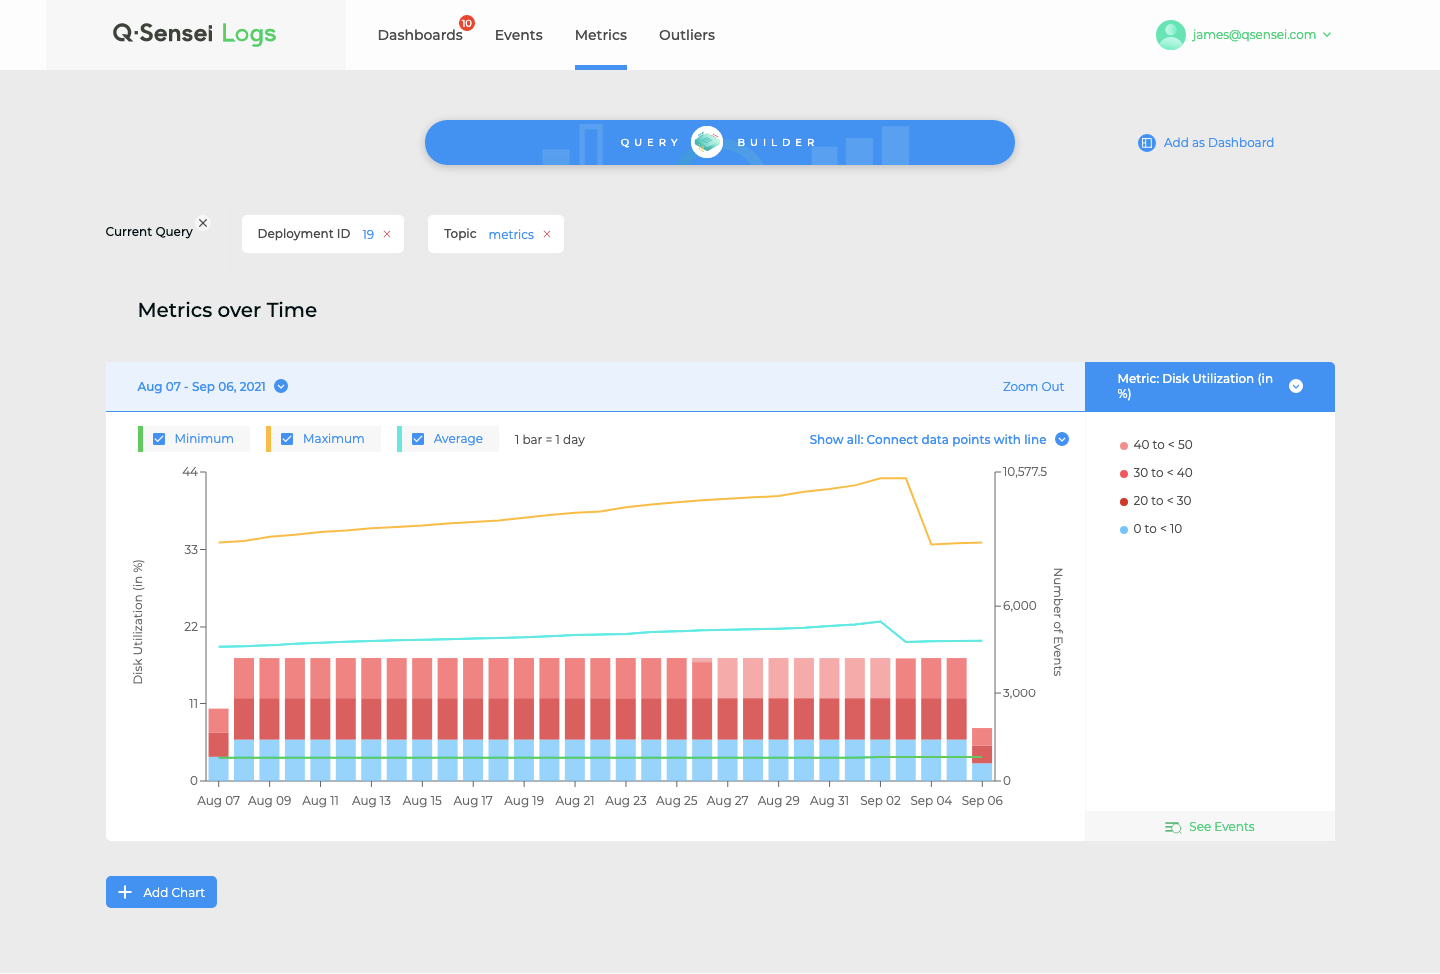
4. Dynamic Binning
Binning is a way to summarize distribution of data points. Dynamic binning takes millions of data points and groups them into bins at multiple scales. The bins update on-the-fly based on filtering criteria.
In the below example, we see bins created for Disk Utilization metric values based on all data points.
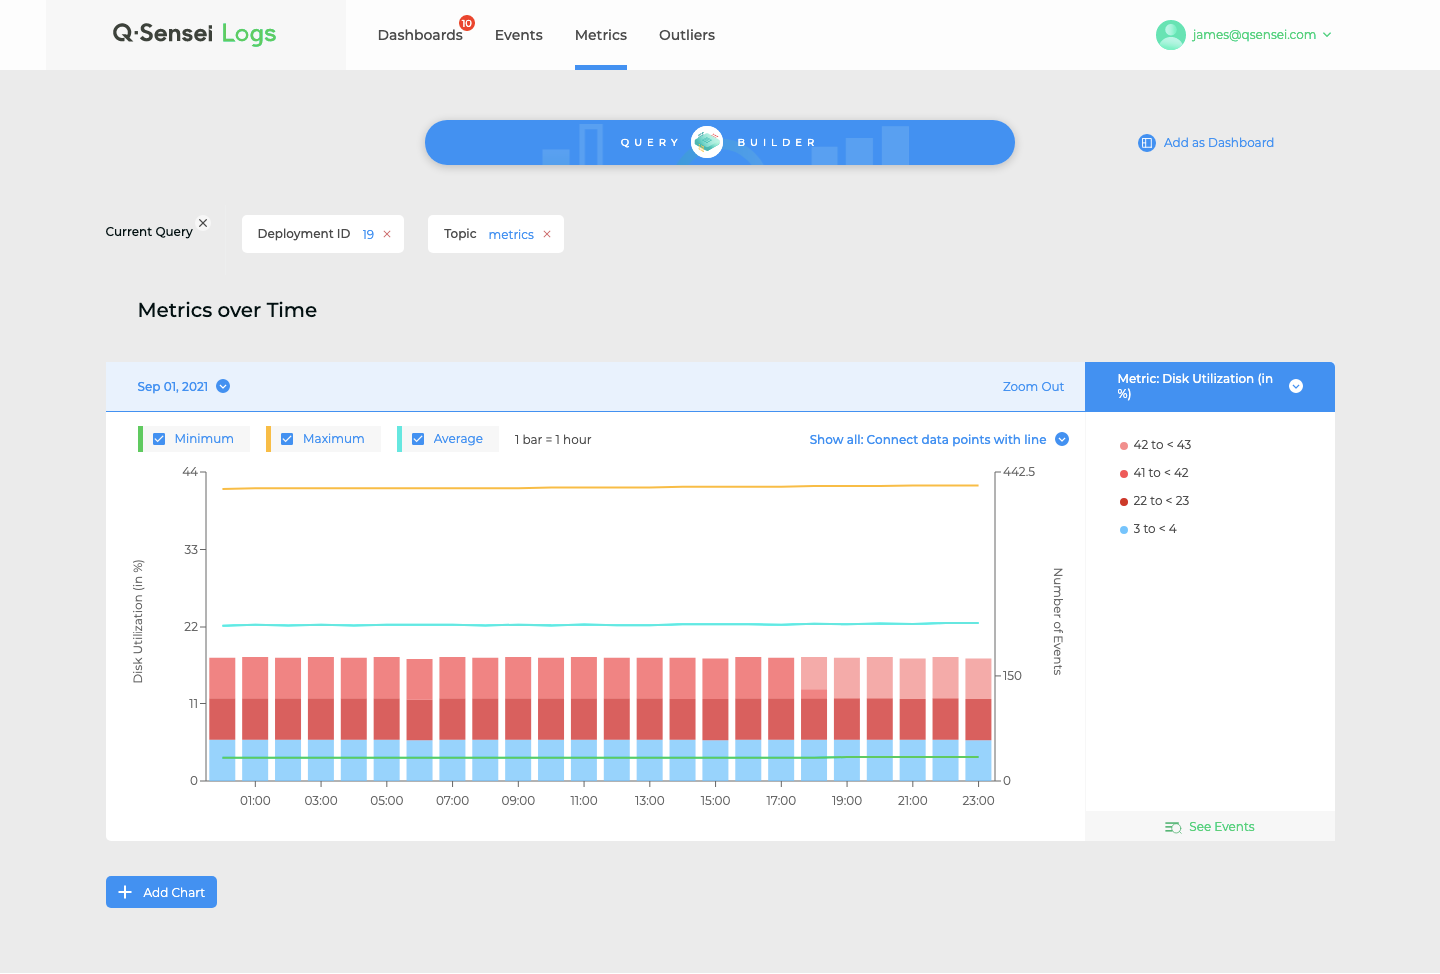
Next, bins and the scale update dynamically after zooming-in.
5. Link to raw events
From the metric tab you can click on See Events to see the raw events based on the specified filtering criteria.