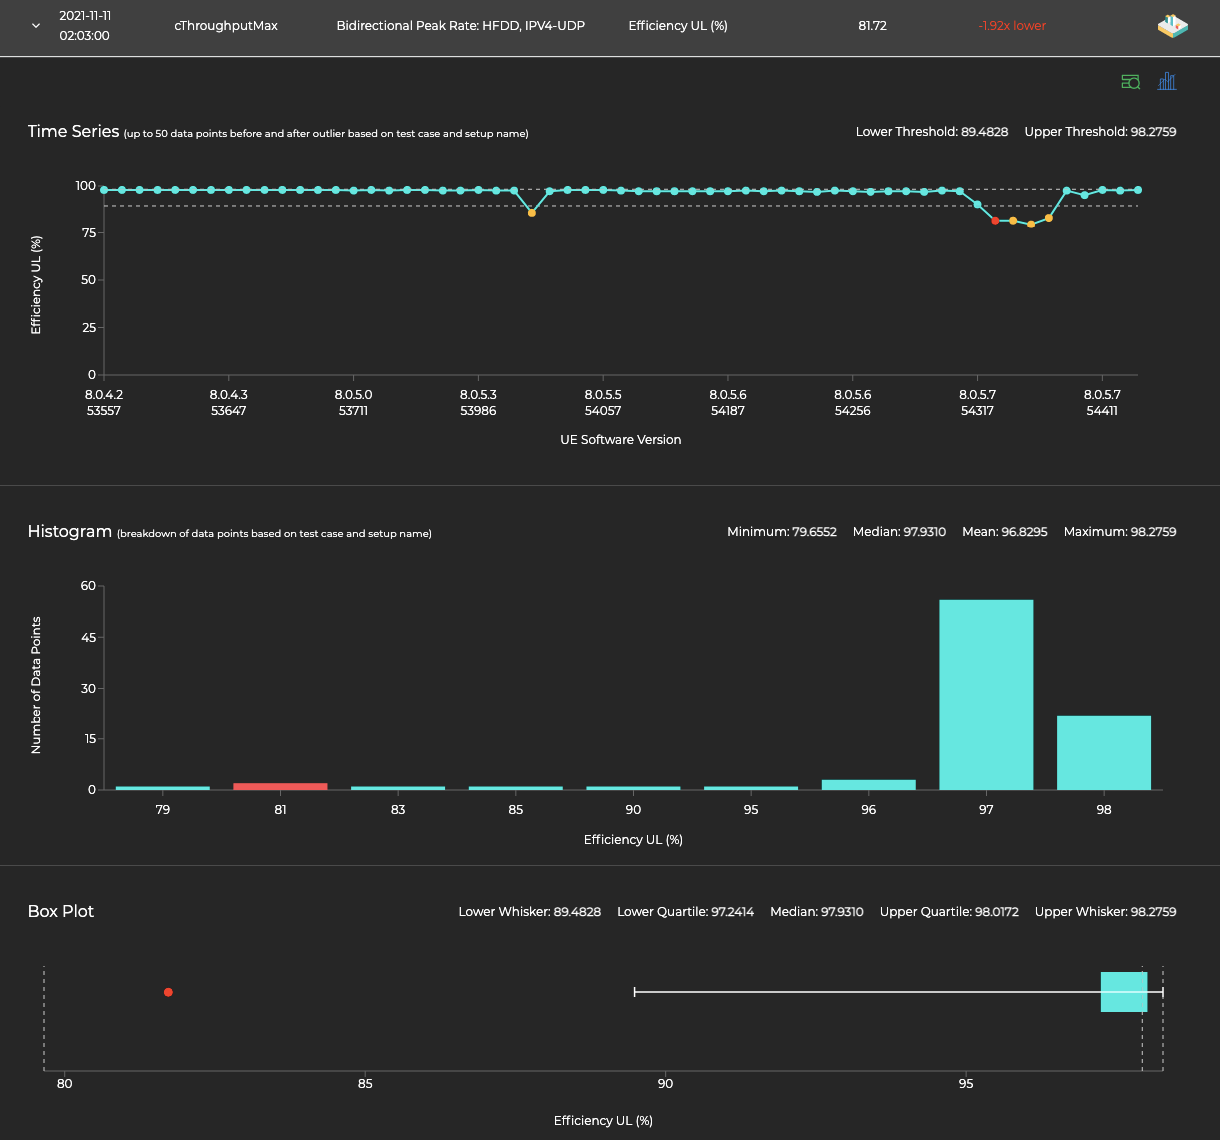
A Box Plot is constructed by drawing a box between the upper and lower quartiles with a line drawn across the box to locate the median. If the lower quartile is Q1 and the upper quartile is Q3, then the difference (Q3 – Q1) is called the interquartile range or IQ.
For Box Plot - Strict we define whiskers as follows:
- Lower whisker: Q1 – 10*IQ
- Upper whisker: Q3 + 10*IQ
A point beyond the whiskers on either side is considered an outlier. In the below box plot, the outlier data point is 1.92x further away from the median than the lower whisker is away from the median.
