RCF provides anomaly detection on streaming data. it can be used to detect spikes in time series data, breaks in periodicity and data point exceptions. This algorithm takes a set of random data points, cuts them down to the same number of data points and builds a collection of models. Each model corresponds to a tree – thus the name random-cut-forests. We will explain working of this algorithm using an example.
Example
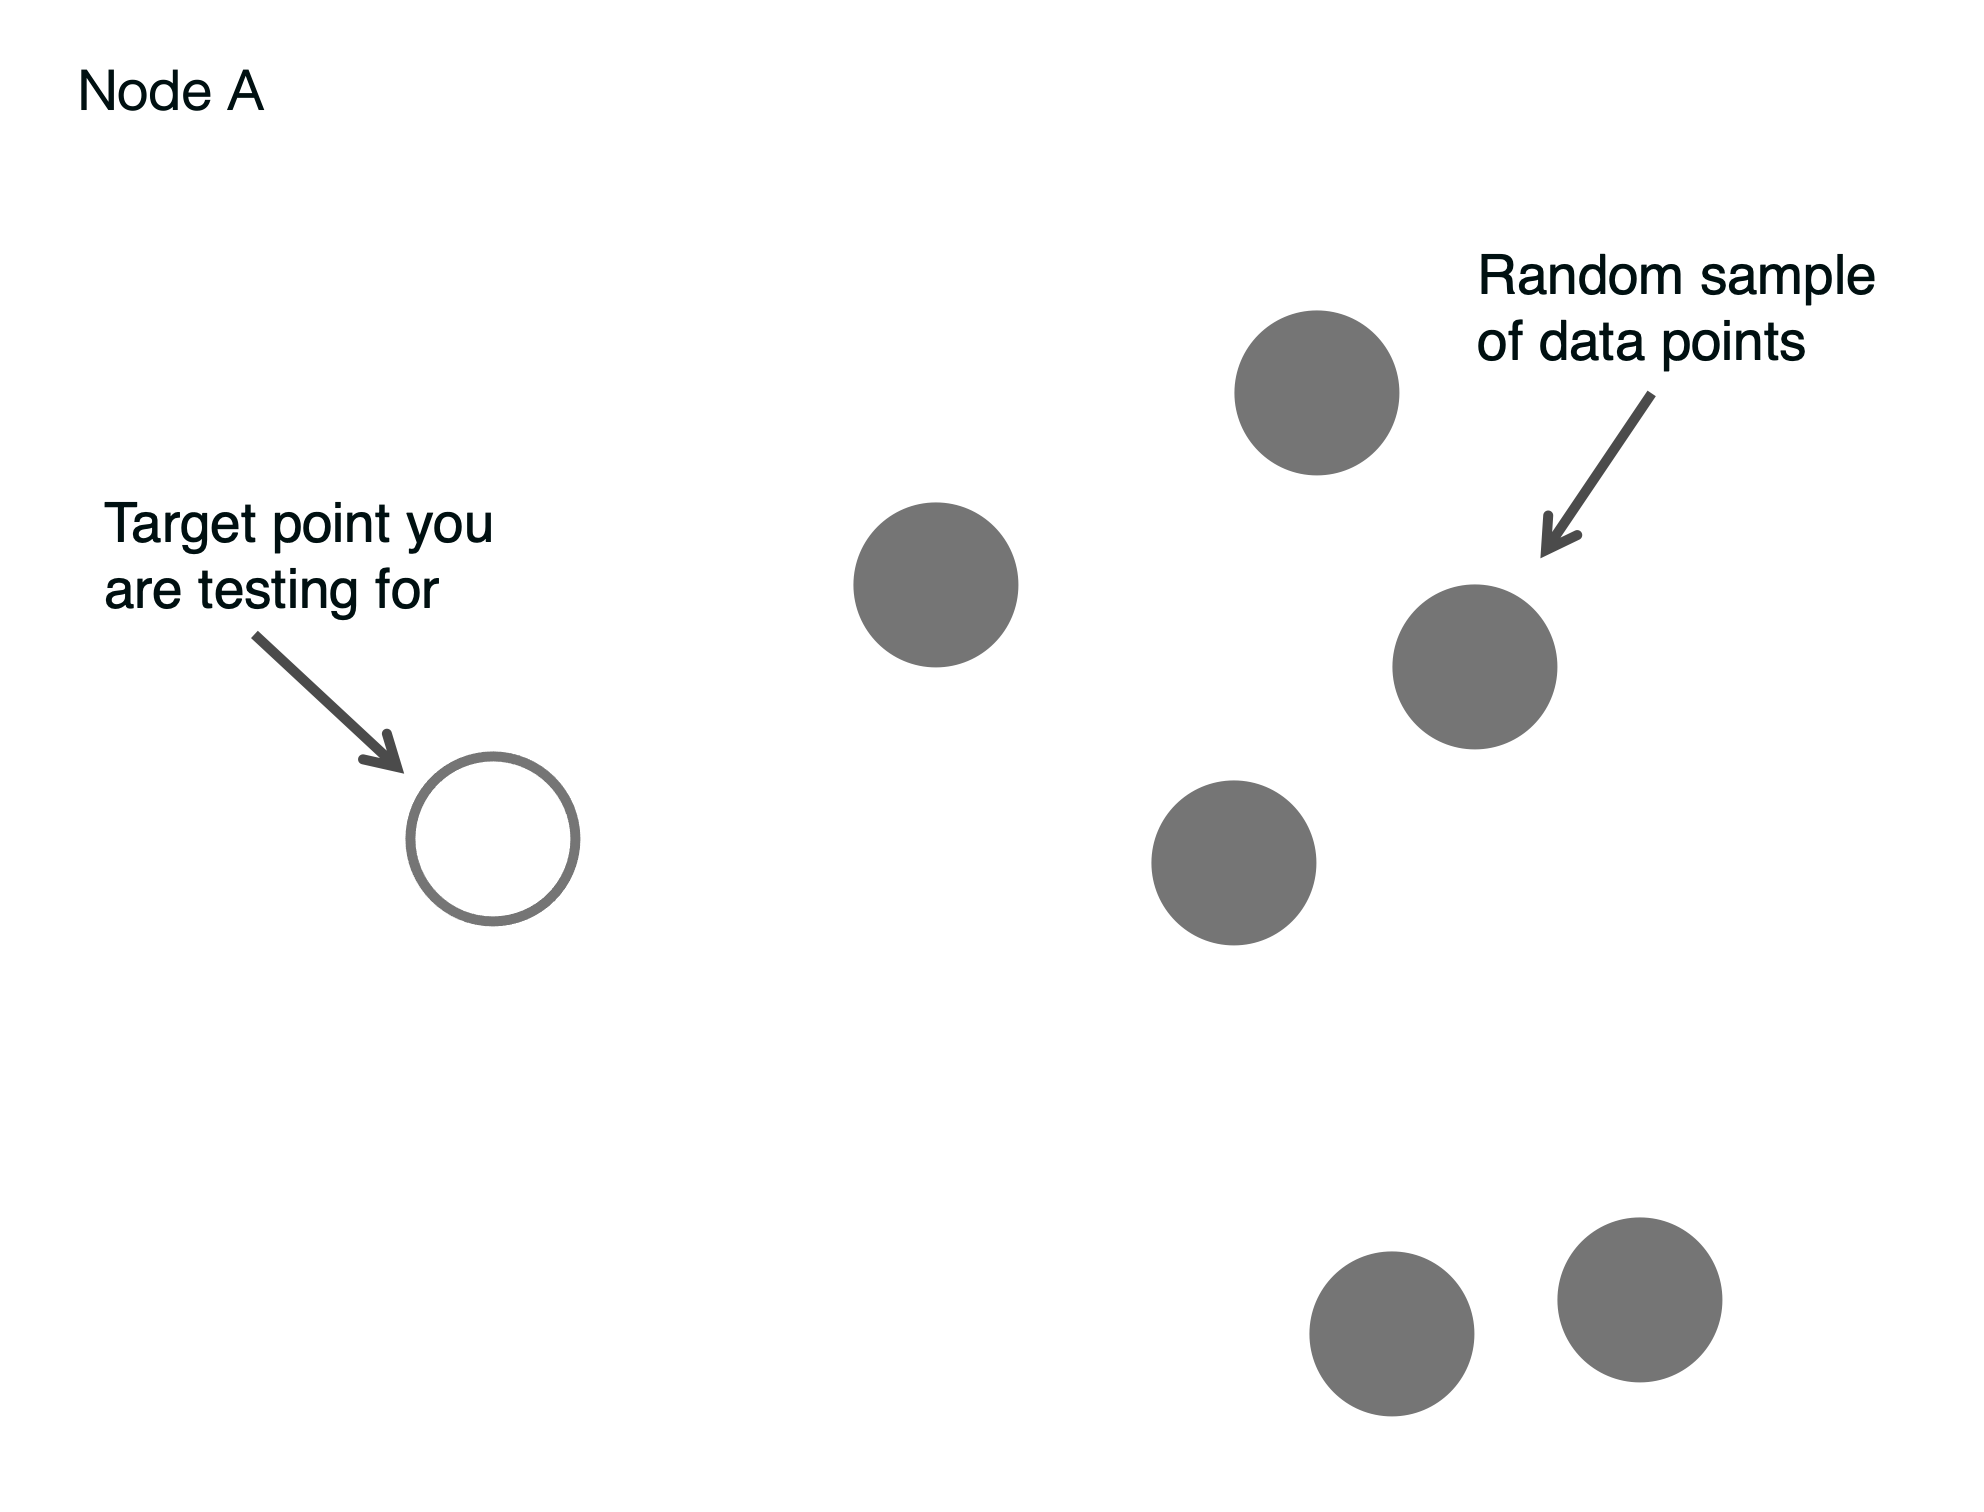
In the below example, we see 6 gray data points pulled at random from the dataset. These data points correspond to a single facet. The white dot represents the new data point which we have to determine if it’s an anomaly. Visually, we can see that the white point sits somewhat far apart from the cluster of gray points. It may or may not be an anomaly.

To determine this algorithmically, we build a tree. The top level of the tree represents all the data points including our test data point.

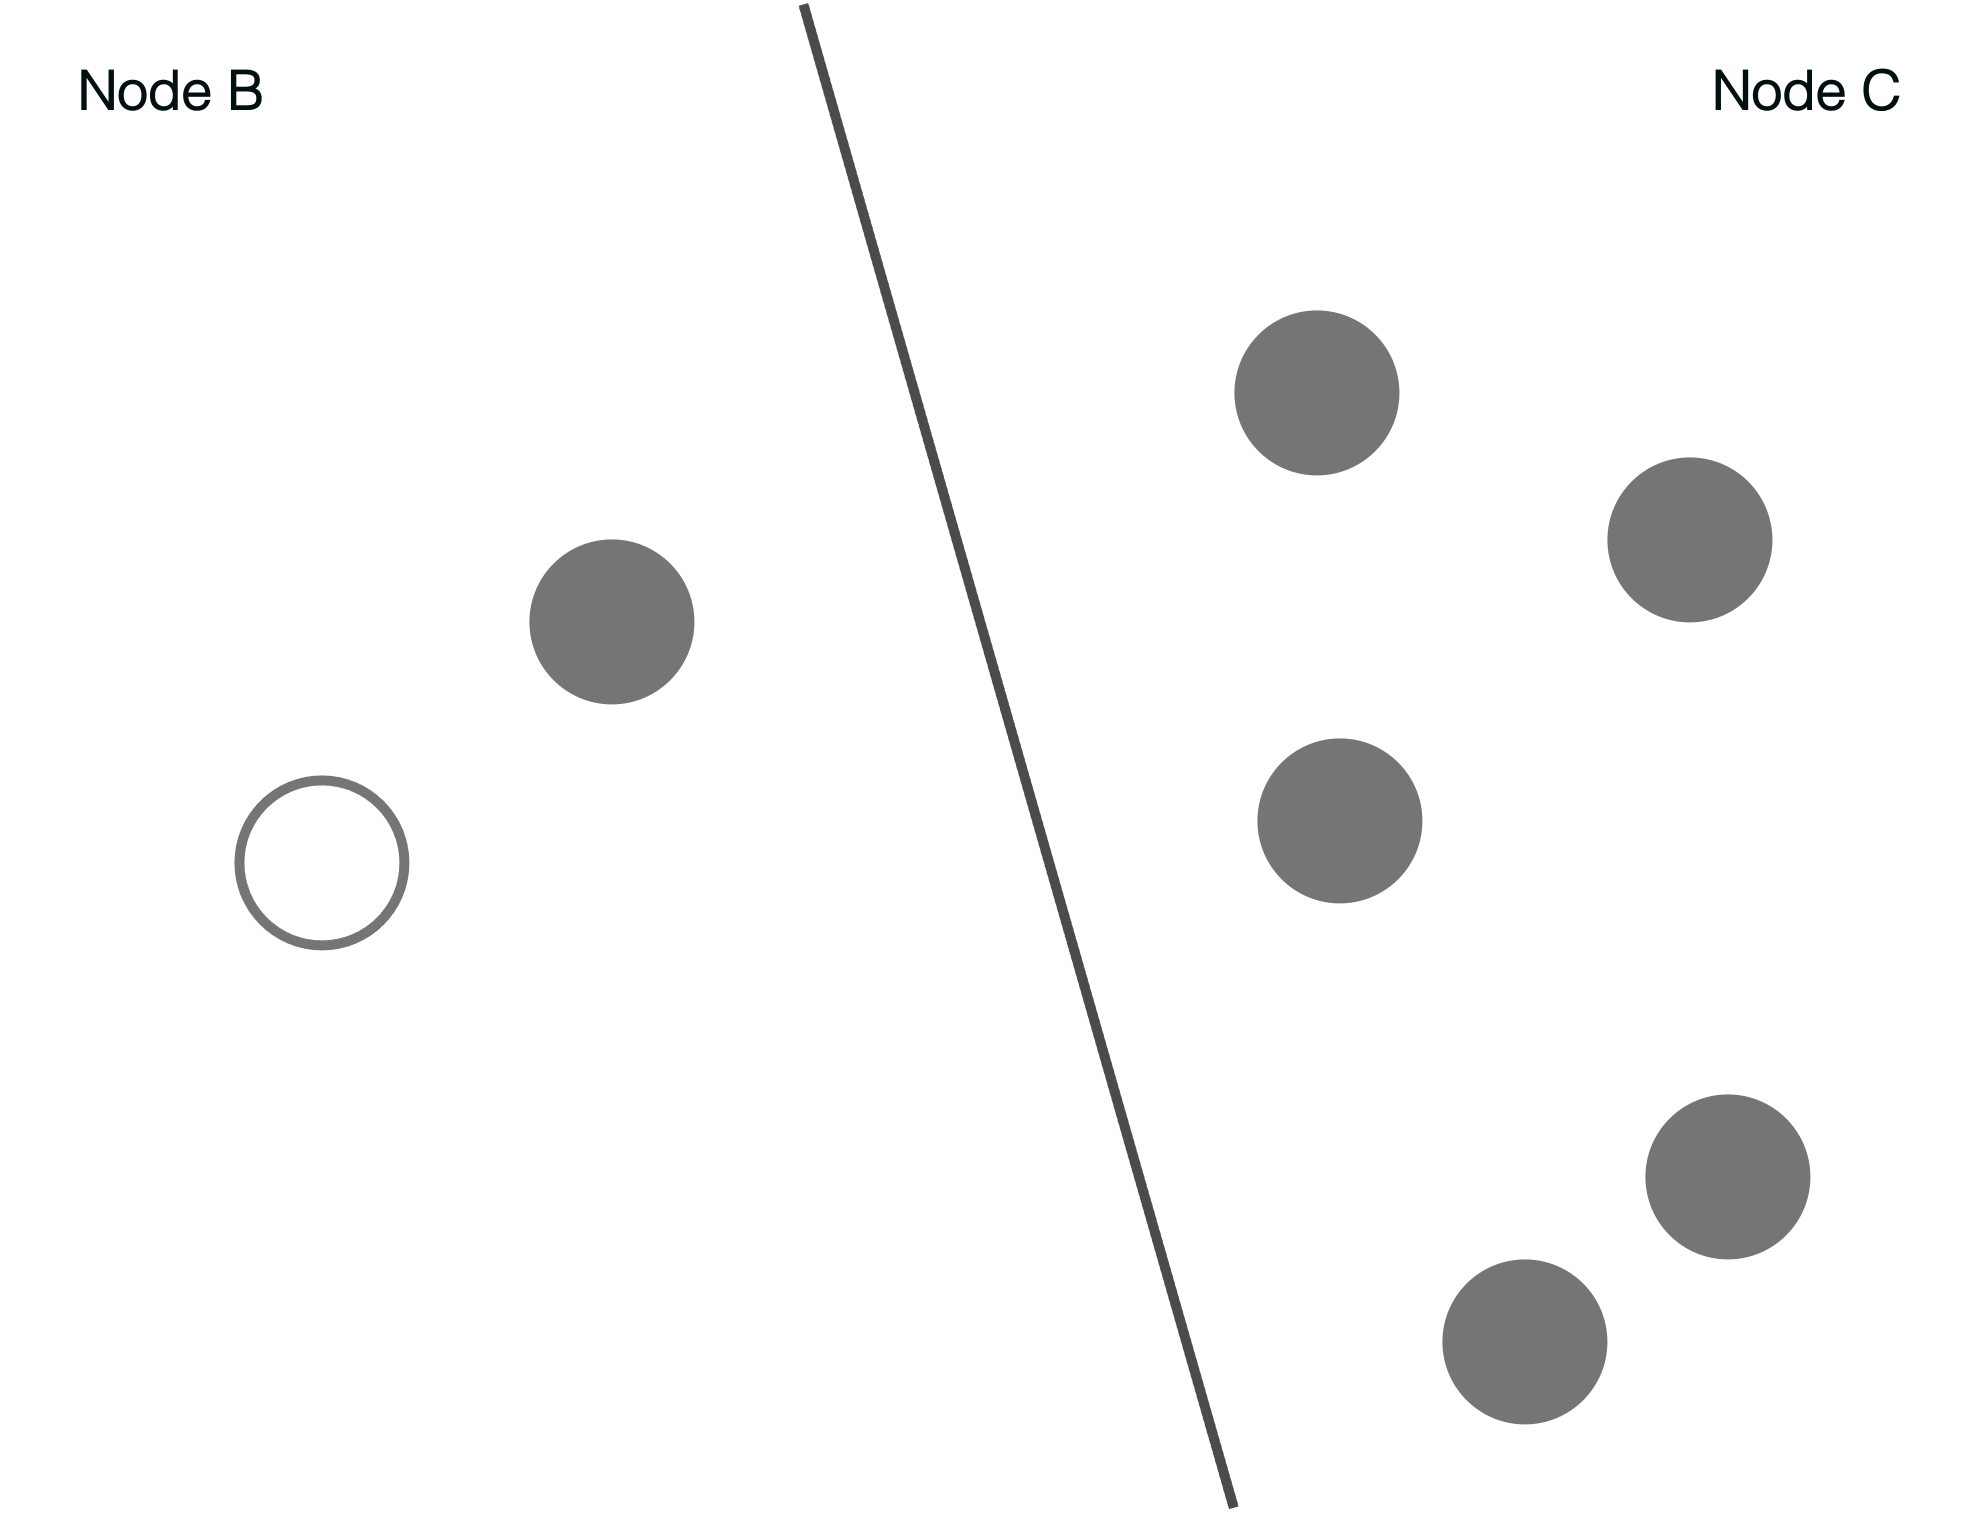
Next, we divide the data points. The subdivided line is inserted at random through the data points. Each side of the subdivision represents a node in the tree.

The below diagram shows the next level of the tree. The left side in the above diagram corresponds to Node B and right side to Node C.

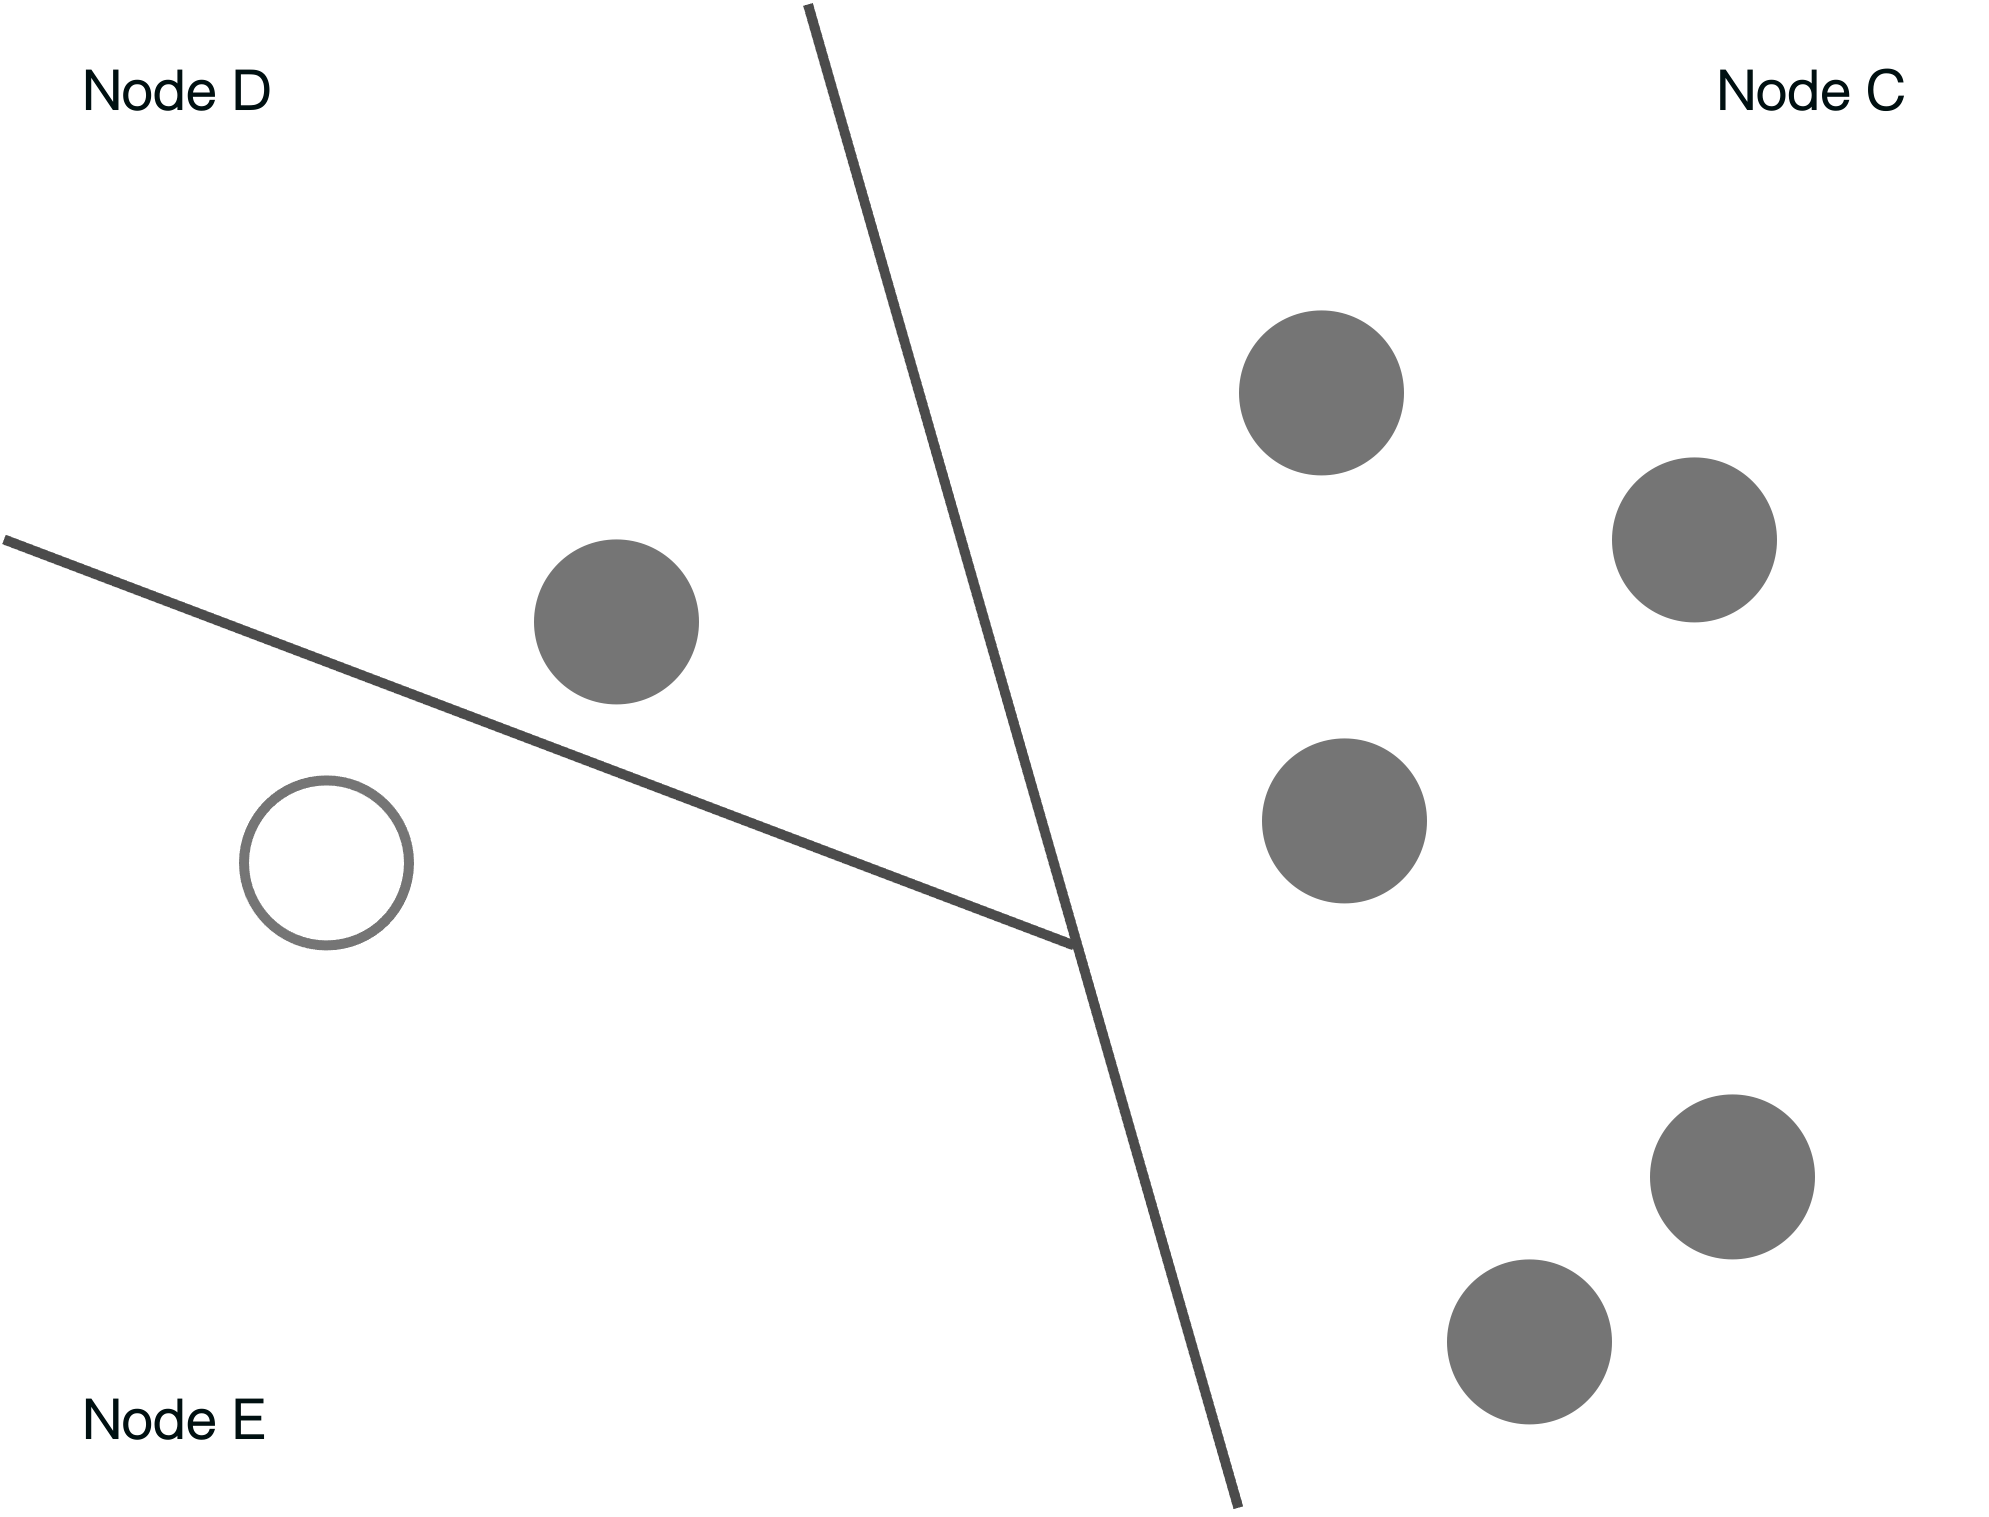
We further subdivide until the target point is isolated in a node.

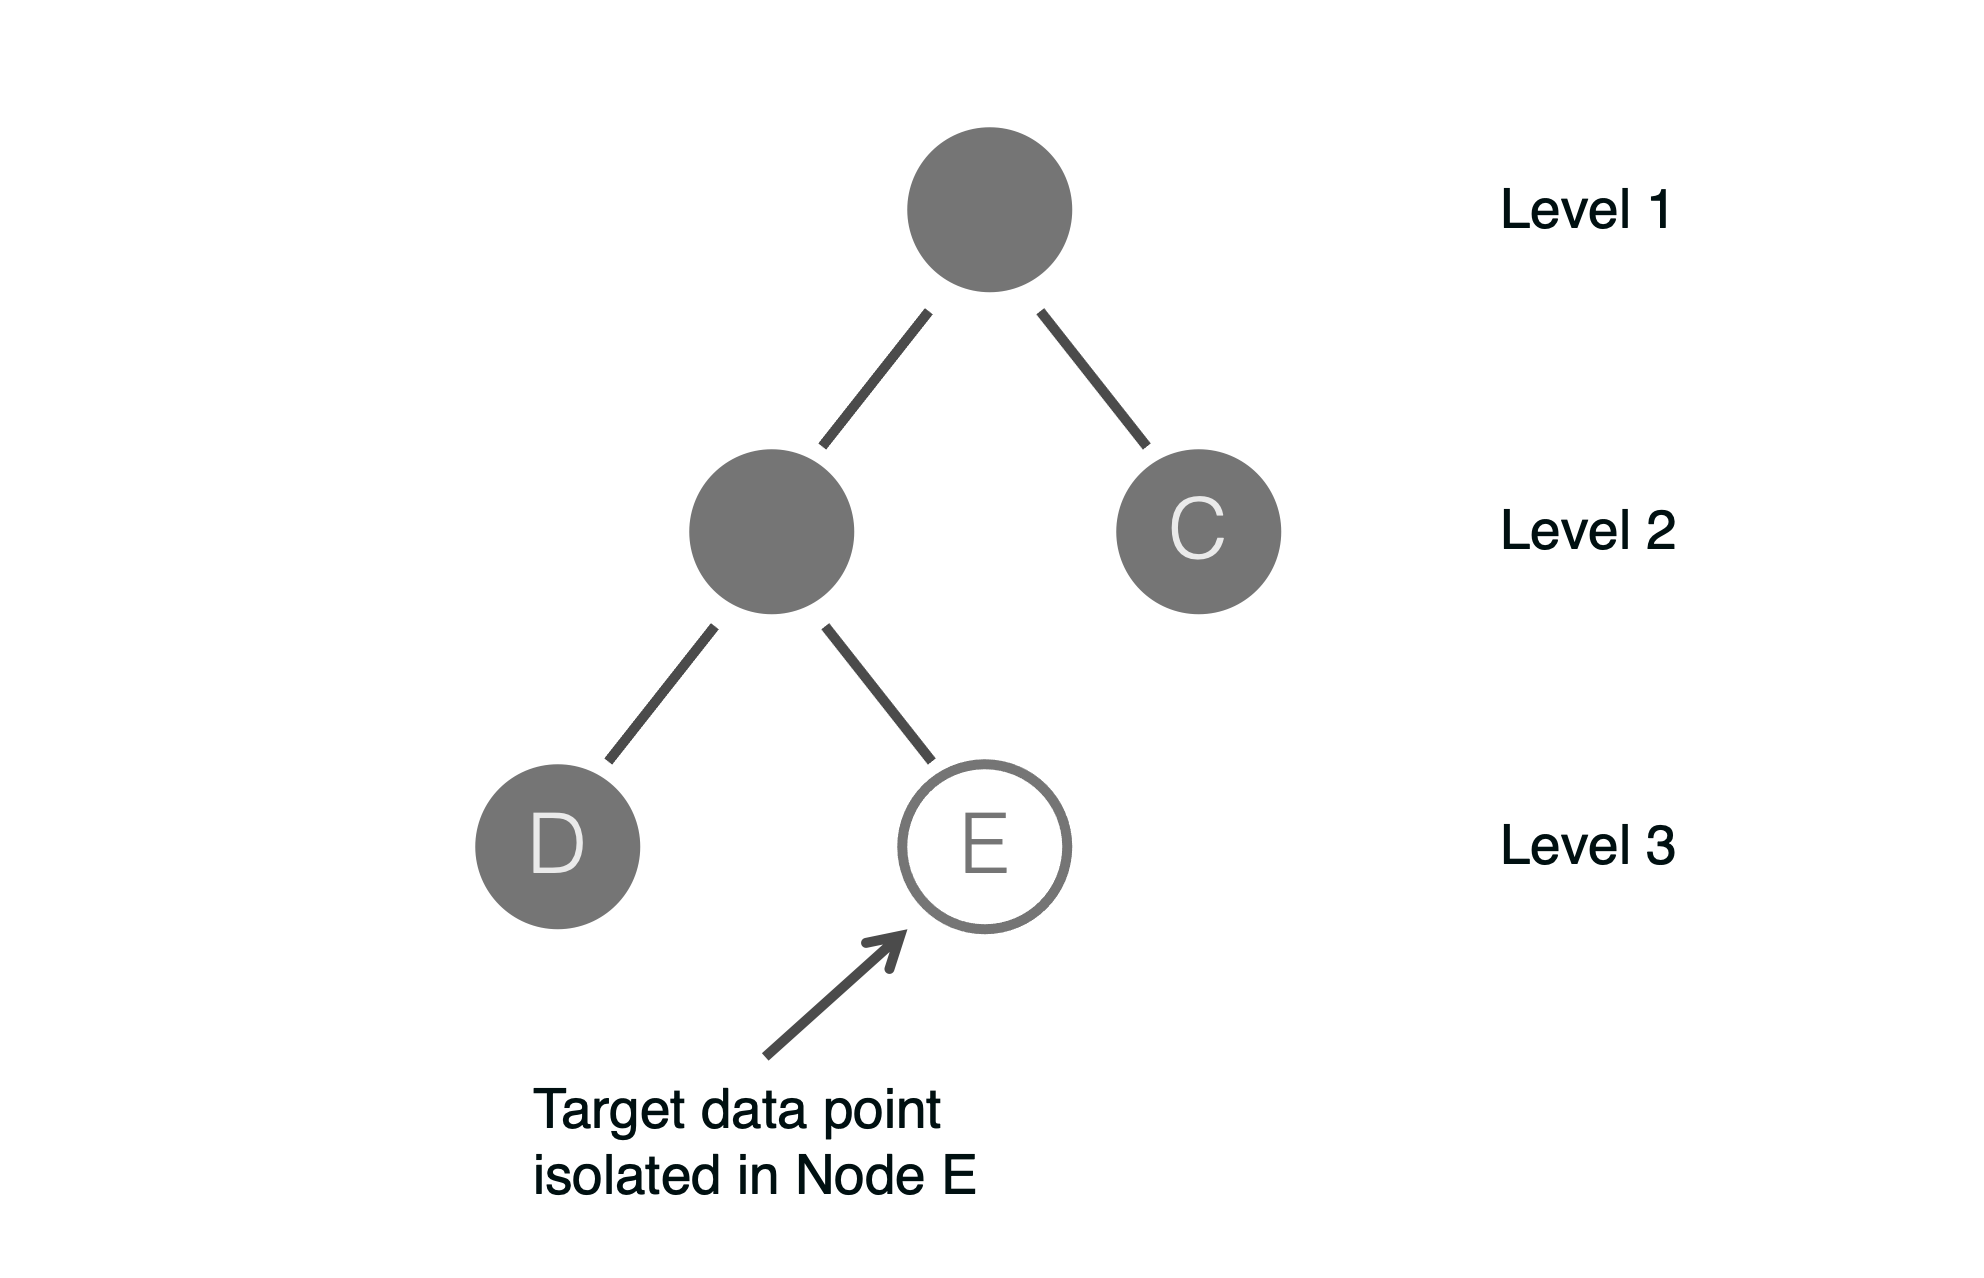
Node E contains the target point, no further subdivision is required.

Notice, the final tree has 3 levels. The smaller the tree, the greater the likelihood the data point is an anomaly. The intuition is you can very quickly isolate the data point in a tree node which only represents the target data point. Thus, the outlier score is inversely proportional to the resulting depth of the data point in the tree.