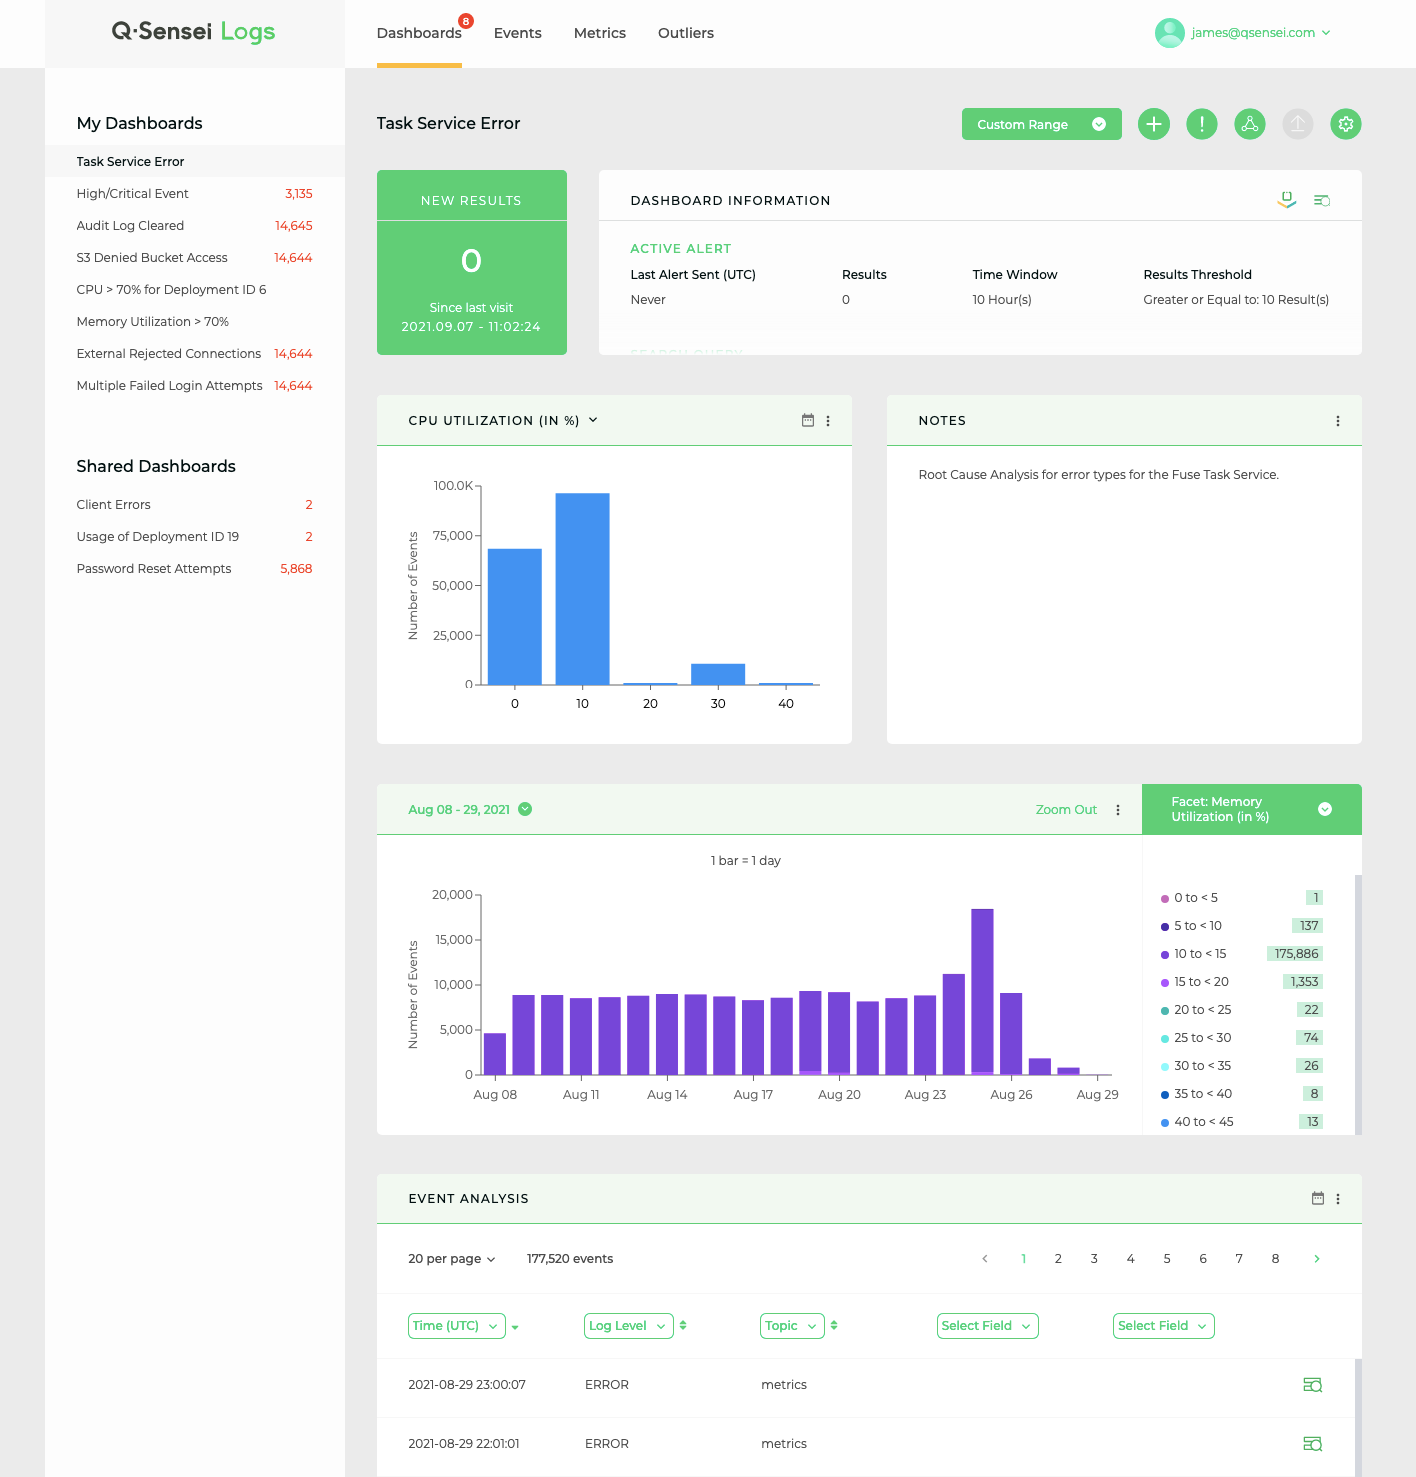
The Q-Sensei Logs Dashboards allow you to effectively monitor your data and gain insights on a specific topic. Almost any query you run in our Outlier Analysis or Event Analysis can be saved as Dashboard to provide you with aggregated results on that topic.
What's great about Dashboard
Dashboards are a critical tool for monitoring and troubleshooting modern applications, allowing you to quickly navigate through your data.
The information you save in a dashboard provides insight into the current state of the data you're uploading to Q-Sensei Logs. Instead of having to run a number of queries, Q-Sensei Logs runs these searches automatically, making sure that you're never looking at old data.
Our Dashboards provide a real-time view of your system, continually updating as data comes in to show you what´s new. You won't have to remember to run important searches once you saved them to dashboards—you'll be able to spend your time gaining insights.
With Q-Sensei Logs you can
- Create personalized dashboards to monitor new log events from a streaming data source.
- Choose from multiple widgets
- Donut
- Histogram
- Time Series
- Table
- Notes
- Share dashboards with multiple users
